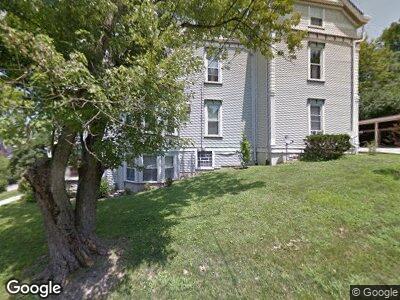
3710 Creighton Place Unit 3 Cincinnati, OH 45226
Columbia Tusculum NeighborhoodEstimated Value: $142,000 - $159,000
1
Bed
1
Bath
788
Sq Ft
$190/Sq Ft
Est. Value
About This Home
This home is located at 3710 Creighton Place Unit 3, Cincinnati, OH 45226 and is currently estimated at $149,506, approximately $189 per square foot. 3710 Creighton Place Unit 3 is a home located in Hamilton County with nearby schools including Clark Montessori High School, Withrow University High School, and Shroder High School.
Ownership History
Date
Name
Owned For
Owner Type
Purchase Details
Closed on
Jan 18, 2024
Sold by
Truck And Deschain Investments Llc
Bought by
Kelly Chandler
Current Estimated Value
Home Financials for this Owner
Home Financials are based on the most recent Mortgage that was taken out on this home.
Original Mortgage
$118,825
Outstanding Balance
$117,417
Interest Rate
7.03%
Mortgage Type
New Conventional
Estimated Equity
$32,089
Purchase Details
Closed on
Nov 29, 2022
Sold by
Lachey Bruce
Bought by
Truck And Deschain Investments Llc
Purchase Details
Closed on
Aug 4, 2016
Sold by
Flanagan Laura
Bought by
Lachey Bruce
Purchase Details
Closed on
Apr 26, 2010
Sold by
Weakley Leonard A
Bought by
Flanagan Laura
Purchase Details
Closed on
Mar 11, 2003
Sold by
Ibold Wilger Michael
Bought by
Weakley Leonard A
Home Financials for this Owner
Home Financials are based on the most recent Mortgage that was taken out on this home.
Original Mortgage
$52,000
Interest Rate
6%
Mortgage Type
Balloon
Create a Home Valuation Report for This Property
The Home Valuation Report is an in-depth analysis detailing your home's value as well as a comparison with similar homes in the area
Home Values in the Area
Average Home Value in this Area
Purchase History
| Date | Buyer | Sale Price | Title Company |
|---|---|---|---|
| Kelly Chandler | $122,500 | None Listed On Document | |
| Truck And Deschain Investments Llc | -- | -- | |
| Lachey Bruce | $72,500 | -- | |
| Flanagan Laura | $95,000 | Attorney | |
| Weakley Leonard A | $78,000 | -- |
Source: Public Records
Mortgage History
| Date | Status | Borrower | Loan Amount |
|---|---|---|---|
| Open | Kelly Chandler | $118,825 | |
| Previous Owner | Weakley Leonard A | $52,000 |
Source: Public Records
Tax History Compared to Growth
Tax History
| Year | Tax Paid | Tax Assessment Tax Assessment Total Assessment is a certain percentage of the fair market value that is determined by local assessors to be the total taxable value of land and additions on the property. | Land | Improvement |
|---|---|---|---|---|
| 2024 | $2,495 | $39,487 | $4,060 | $35,427 |
| 2023 | $2,500 | $39,487 | $4,060 | $35,427 |
| 2022 | $2,172 | $31,973 | $4,277 | $27,696 |
| 2021 | $2,092 | $31,973 | $4,277 | $27,696 |
| 2020 | $2,153 | $31,973 | $4,277 | $27,696 |
| 2019 | $1,875 | $25,375 | $3,395 | $21,980 |
| 2018 | $1,878 | $25,375 | $3,395 | $21,980 |
| 2017 | $1,784 | $25,375 | $3,395 | $21,980 |
| 2016 | $2,061 | $28,928 | $2,954 | $25,974 |
| 2015 | $1,858 | $28,928 | $2,954 | $25,974 |
| 2014 | $1,871 | $28,928 | $2,954 | $25,974 |
| 2013 | $2,188 | $33,250 | $3,395 | $29,855 |
Source: Public Records
Map
Nearby Homes
- 3628 Woodbridge Place
- 546 Tusculum Ave Unit 546
- 550 Tusculum Ave Unit 550
- 429 Stanley Ave
- 431 Stanley Ave
- 414 Strafer St
- 468 Strafer St
- 459 Strafer St
- 3942 Feemster St
- 3524 Handman Ave
- 3516 Handman Ave
- 459 Flinn Ave
- 455 Flinn Ave
- 536 Hoge St
- 457 Flinn Ave
- 3669 Vineyard Place
- 444 Delta Ave
- 262 Worth St
- 220 Worth St
- 4368 Eastern Ave