3711 Avenue M Brooklyn, NY 11234
Marine Park NeighborhoodEstimated Value: $903,931 - $1,001,000
6
Beds
3
Baths
2,480
Sq Ft
$378/Sq Ft
Est. Value
About This Home
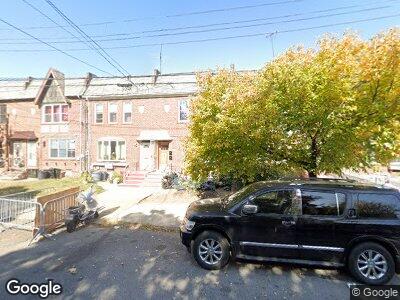
This home is located at 3711 Avenue M, Brooklyn, NY 11234 and is currently estimated at $937,983, approximately $378 per square foot. 3711 Avenue M is a home located in Kings County with nearby schools including P.S. 119 Amersfort, Andries Hudde School, and Midwood Catholic Academy.
Ownership History
Date
Name
Owned For
Owner Type
Purchase Details
Closed on
Jan 11, 2024
Sold by
Adeline Sineus As Srviving Spouse and Adeline St. Cyr As Srviving
Bought by
Mohsin Mohammed
Current Estimated Value
Home Financials for this Owner
Home Financials are based on the most recent Mortgage that was taken out on this home.
Original Mortgage
$696,000
Outstanding Balance
$687,724
Interest Rate
6.61%
Mortgage Type
Purchase Money Mortgage
Estimated Equity
$237,440
Purchase Details
Closed on
Jul 15, 1996
Sold by
Sineus Joseph and Michel Guirlene
Bought by
Sineus Joseph and Stcyr Adeline
Purchase Details
Closed on
Mar 8, 1994
Sold by
Collier Brian T and Collier Theresa A
Bought by
Sineus Joseph and Michel Guirlene
Home Financials for this Owner
Home Financials are based on the most recent Mortgage that was taken out on this home.
Original Mortgage
$197,650
Interest Rate
7.45%
Mortgage Type
FHA
Create a Home Valuation Report for This Property
The Home Valuation Report is an in-depth analysis detailing your home's value as well as a comparison with similar homes in the area
Home Values in the Area
Average Home Value in this Area
Purchase History
| Date | Buyer | Sale Price | Title Company |
|---|---|---|---|
| Mohsin Mohammed | $870,000 | -- | |
| Mohsin Mohammed | $870,000 | -- | |
| Sineus Joseph | -- | -- | |
| Sineus Joseph | -- | -- |
Source: Public Records
Mortgage History
| Date | Status | Borrower | Loan Amount |
|---|---|---|---|
| Open | Mohsin Mohammed | $696,000 | |
| Closed | Mohsin Mohammed | $696,000 | |
| Previous Owner | Sineus Joseph | $495,000 | |
| Previous Owner | Sineus Joseph | $464,000 | |
| Previous Owner | Sineus Joseph | $395,000 | |
| Previous Owner | Sineus Joseph | $315,000 | |
| Previous Owner | Sineus Joseph | $270,000 | |
| Previous Owner | Sineus Joseph | $197,650 |
Source: Public Records
Tax History Compared to Growth
Tax History
| Year | Tax Paid | Tax Assessment Tax Assessment Total Assessment is a certain percentage of the fair market value that is determined by local assessors to be the total taxable value of land and additions on the property. | Land | Improvement |
|---|---|---|---|---|
| 2024 | $7,740 | $51,600 | $10,080 | $41,520 |
| 2023 | $7,939 | $50,220 | $10,080 | $40,140 |
| 2022 | $7,686 | $44,520 | $10,080 | $34,440 |
| 2021 | $7,683 | $43,800 | $10,080 | $33,720 |
| 2020 | $5,762 | $49,620 | $10,080 | $39,540 |
| 2019 | $6,721 | $41,880 | $10,080 | $31,800 |
| 2018 | $6,533 | $35,280 | $7,819 | $27,461 |
| 2017 | $6,455 | $34,836 | $8,421 | $26,415 |
| 2016 | $5,983 | $33,033 | $9,024 | $24,009 |
| 2015 | $3,964 | $31,164 | $9,858 | $21,306 |
| 2014 | $3,964 | $29,400 | $11,160 | $18,240 |
Source: Public Records
Map
Nearby Homes
- 3708 Avenue M
- 3626 Kings Hwy Unit 5K
- 3626 Kings Hwy Unit 4D
- 1396 E 38th St
- 3622 Avenue M
- 3844 Flatlands Ave
- 3524 Avenue M
- 1970 Flatbush Ave
- 1330 E 36th St
- 1530 Coleman St
- 1328 E 35th St
- 1329 E 37th St
- 1526 E 38th St
- 1530 E 38th St
- 3402 Kings Hwy
- 1315 E 37th St Unit 1317
- 1561 E 37th St
- 1327 E 34th St
- 3224 Avenue L
- 2130 Troy Ave