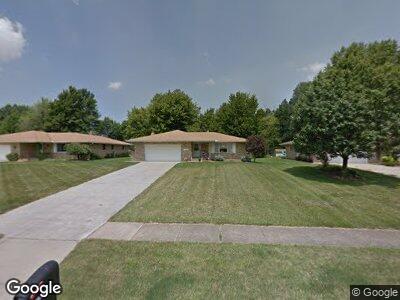
3713 Dorset Dr Brooklyn Heights, OH 44131
Brooklyn Heights NeighborhoodEstimated Value: $272,000 - $357,000
3
Beds
2
Baths
1,825
Sq Ft
$169/Sq Ft
Est. Value
About This Home
This home is located at 3713 Dorset Dr, Brooklyn Heights, OH 44131 and is currently estimated at $308,003, approximately $168 per square foot. 3713 Dorset Dr is a home located in Cuyahoga County with nearby schools including Cuyahoga Heights Elementary School, Cuyahoga Heights Middle School, and Cuyahoga Heights High School.
Ownership History
Date
Name
Owned For
Owner Type
Purchase Details
Closed on
Jul 8, 2021
Sold by
Warner Russell J and Warner Melisa A
Bought by
Warner Bradley
Current Estimated Value
Purchase Details
Closed on
Jun 24, 2005
Sold by
Veverka Charles and Copfer Cindy
Bought by
Warner Russell J and Warner Melisa A
Home Financials for this Owner
Home Financials are based on the most recent Mortgage that was taken out on this home.
Original Mortgage
$50,000
Interest Rate
5.74%
Mortgage Type
Unknown
Purchase Details
Closed on
May 24, 1994
Sold by
Veverka Charles and Veverka Rose
Bought by
Veverka Charles
Purchase Details
Closed on
Apr 27, 1987
Sold by
Young Joseph P
Bought by
Veverka Charles and Veverka Rose
Purchase Details
Closed on
Dec 27, 1983
Sold by
Young Joseph P and Young Lucy R
Bought by
Young Joseph P
Purchase Details
Closed on
Jan 1, 1975
Bought by
Young Joseph P and Young Lucy R
Create a Home Valuation Report for This Property
The Home Valuation Report is an in-depth analysis detailing your home's value as well as a comparison with similar homes in the area
Home Values in the Area
Average Home Value in this Area
Purchase History
| Date | Buyer | Sale Price | Title Company |
|---|---|---|---|
| Warner Russell J | -- | Ohio Title Corp | |
| Warner Russell J | -- | Ohio Title Corp | |
| Warner Russell J | $182,000 | Ohio Title Corp | |
| Veverka Charles | -- | -- | |
| Veverka Charles | $110,000 | -- | |
| Young Joseph P | -- | -- | |
| Young Joseph P | -- | -- |
Source: Public Records
Mortgage History
| Date | Status | Borrower | Loan Amount |
|---|---|---|---|
| Open | Warner Russell J | $124,000 | |
| Closed | Warner Russell J | $50,000 | |
| Closed | Warner Russell J | $132,000 |
Source: Public Records
Tax History Compared to Growth
Tax History
| Year | Tax Paid | Tax Assessment Tax Assessment Total Assessment is a certain percentage of the fair market value that is determined by local assessors to be the total taxable value of land and additions on the property. | Land | Improvement |
|---|---|---|---|---|
| 2024 | $4,004 | $91,595 | $20,895 | $70,700 |
| 2023 | $3,875 | $76,860 | $15,890 | $60,970 |
| 2022 | $3,842 | $76,860 | $15,890 | $60,970 |
| 2021 | $3,783 | $76,860 | $15,890 | $60,970 |
| 2020 | $3,567 | $65,140 | $13,480 | $51,660 |
| 2019 | $3,421 | $186,100 | $38,500 | $147,600 |
| 2018 | $3,266 | $65,140 | $13,480 | $51,660 |
| 2017 | $3,169 | $56,670 | $13,900 | $42,770 |
| 2016 | $3,137 | $56,670 | $13,900 | $42,770 |
| 2015 | $3,236 | $56,670 | $13,900 | $42,770 |
| 2014 | $3,236 | $58,420 | $14,320 | $44,100 |
Source: Public Records
Map
Nearby Homes
- 5860 Mural Dr
- 1700 S Circle View Dr
- Lot C Lombardo Center
- 6014 Crossview Rd
- 1184 E Dartmoor Ave
- 1329 E Schaaf Rd
- 5674 Cascade Dr
- 1051 Rockside Rd
- 5705 W Longridge Dr
- 6135 Meadview Dr
- 252 E Hillsdale Ave
- 6264 Gale Dr
- 6139 Saint Joseph Dr
- 5091 W 6th St
- 0 Acorn Dr Unit 5023848
- 6313 Gale Dr
- 1203 Old Rockside Rd
- 5546 Windrush Ct Unit 94E
- 1118 Clearview Ave
- 6372 Tanglewood Ln