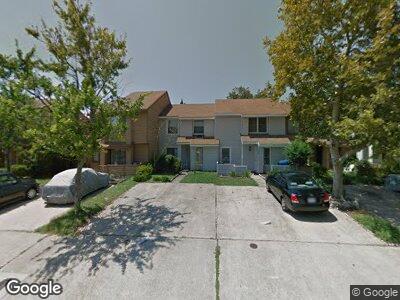
3728 Chimney Creek Dr Virginia Beach, VA 23462
Green Run NeighborhoodEstimated Value: $222,000 - $254,000
2
Beds
1
Bath
1,054
Sq Ft
$224/Sq Ft
Est. Value
About This Home
This home is located at 3728 Chimney Creek Dr, Virginia Beach, VA 23462 and is currently estimated at $236,199, approximately $224 per square foot. 3728 Chimney Creek Dr is a home located in Virginia Beach City with nearby schools including White Oaks Elementary School, Larkspur Middle School, and Green Run High School.
Ownership History
Date
Name
Owned For
Owner Type
Purchase Details
Closed on
Jun 25, 2021
Sold by
Winnie Michelle L
Bought by
Leaks Jackson Deborah
Current Estimated Value
Home Financials for this Owner
Home Financials are based on the most recent Mortgage that was taken out on this home.
Original Mortgage
$175,757
Outstanding Balance
$161,872
Interest Rate
2.9%
Mortgage Type
FHA
Estimated Equity
$74,950
Purchase Details
Closed on
Nov 11, 2014
Sold by
Ferguson Donna
Bought by
Winnie Michelle L
Home Financials for this Owner
Home Financials are based on the most recent Mortgage that was taken out on this home.
Original Mortgage
$102,783
Interest Rate
4.13%
Mortgage Type
VA
Purchase Details
Closed on
Oct 22, 2004
Sold by
Lejeune William
Bought by
Ferguson Donna
Home Financials for this Owner
Home Financials are based on the most recent Mortgage that was taken out on this home.
Original Mortgage
$90,000
Interest Rate
5.85%
Create a Home Valuation Report for This Property
The Home Valuation Report is an in-depth analysis detailing your home's value as well as a comparison with similar homes in the area
Home Values in the Area
Average Home Value in this Area
Purchase History
| Date | Buyer | Sale Price | Title Company |
|---|---|---|---|
| Leaks Jackson Deborah | $179,000 | Fidelity National Ttl Ins Co | |
| Winnie Michelle L | $99,500 | -- | |
| Ferguson Donna | $90,000 | -- |
Source: Public Records
Mortgage History
| Date | Status | Borrower | Loan Amount |
|---|---|---|---|
| Open | Leaks Jackson Deborah | $175,757 | |
| Previous Owner | Winnie Michelle L | $118,795 | |
| Previous Owner | Winnie Michelle L | $102,783 | |
| Previous Owner | Ferguson Donna | $90,000 |
Source: Public Records
Tax History Compared to Growth
Tax History
| Year | Tax Paid | Tax Assessment Tax Assessment Total Assessment is a certain percentage of the fair market value that is determined by local assessors to be the total taxable value of land and additions on the property. | Land | Improvement |
|---|---|---|---|---|
| 2024 | $1,897 | $195,600 | $78,000 | $117,600 |
| 2023 | $1,811 | $182,900 | $75,000 | $107,900 |
| 2022 | $1,616 | $163,200 | $65,000 | $98,200 |
| 2021 | $1,403 | $141,700 | $59,000 | $82,700 |
| 2020 | $1,348 | $132,500 | $54,000 | $78,500 |
| 2019 | $1,232 | $120,000 | $50,000 | $70,000 |
| 2018 | $1,203 | $120,000 | $50,000 | $70,000 |
| 2017 | $1,118 | $111,500 | $46,000 | $65,500 |
| 2016 | $1,068 | $107,900 | $44,000 | $63,900 |
| 2015 | $1,110 | $112,100 | $48,200 | $63,900 |
| 2014 | $994 | $106,900 | $47,500 | $59,400 |
Source: Public Records
Map
Nearby Homes
- 725 Woodbox Dr
- 3635 Essex Pond Quay
- 3866 Chimney Creek Dr
- 810 Crashaw St
- 3777 Governors Way
- 3781 Governors Way
- 621 Fox Hollow Ln
- 702 Weymouth Ct
- 800 Bunyan Ct
- 3819 Magwood Ct
- 3801 Forrester Ln
- 3914 Filbert Way
- 913 Hunley Dr
- 918 Hunley Dr
- 3518 Davies Ct
- 3717 Bancroft Dr
- 722 Hayes Ave
- 842 Devereaux Dr
- 4112 Loblolly Ln
- 3503 Davies Ct