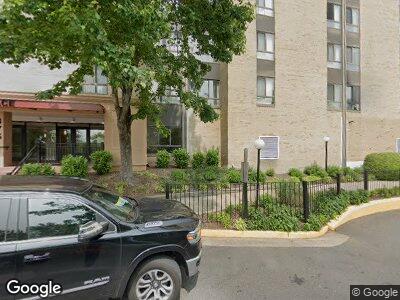
375 S Reynolds St Alexandria, VA 22304
Landmark NeighborhoodEstimated Value: $33,126,962
--
Bed
209
Baths
224,360
Sq Ft
$148/Sq Ft
Est. Value
About This Home
This home is located at 375 S Reynolds St, Alexandria, VA 22304 and is currently estimated at $33,126,962, approximately $147 per square foot. 375 S Reynolds St is a home located in Alexandria City with nearby schools including Samuel W. Tucker Elementary School, Francis C. Hammond Middle, and Alexandria City High School.
Ownership History
Date
Name
Owned For
Owner Type
Purchase Details
Closed on
May 21, 1998
Sold by
Reynolds Associates Lp
Bought by
Essex House Lp
Current Estimated Value
Create a Home Valuation Report for This Property
The Home Valuation Report is an in-depth analysis detailing your home's value as well as a comparison with similar homes in the area
Home Values in the Area
Average Home Value in this Area
Purchase History
| Date | Buyer | Sale Price | Title Company |
|---|---|---|---|
| Essex House Lp | $10,057,020 | -- |
Source: Public Records
Mortgage History
| Date | Status | Borrower | Loan Amount |
|---|---|---|---|
| Open | Essex House Limited Partnershi | $494,447 |
Source: Public Records
Tax History Compared to Growth
Tax History
| Year | Tax Paid | Tax Assessment Tax Assessment Total Assessment is a certain percentage of the fair market value that is determined by local assessors to be the total taxable value of land and additions on the property. | Land | Improvement |
|---|---|---|---|---|
| 2024 | $349,536 | $29,472,000 | $8,491,223 | $20,980,777 |
| 2023 | $366,200 | $32,991,000 | $8,491,223 | $24,499,777 |
| 2022 | $361,061 | $32,528,000 | $8,491,223 | $24,036,777 |
| 2021 | $348,485 | $31,395,000 | $8,491,223 | $22,903,777 |
| 2020 | $361,610 | $31,740,000 | $8,491,223 | $23,248,777 |
| 2019 | $351,679 | $31,122,000 | $8,491,223 | $22,630,777 |
| 2018 | $338,334 | $29,941,100 | $8,491,223 | $21,449,877 |
| 2017 | $325,101 | $28,770,000 | $8,491,223 | $20,278,777 |
| 2016 | $308,702 | $28,770,000 | $8,491,223 | $20,278,777 |
| 2015 | $230,635 | $22,112,689 | $4,764,812 | $17,347,877 |
| 2014 | $226,577 | $21,723,589 | $4,764,812 | $16,958,777 |
Source: Public Records
Map
Nearby Homes
- 250 S Reynolds St Unit 612
- 250 S Reynolds St Unit 1008
- 250 S Reynolds St Unit 1001
- 250 S Reynolds St Unit 1212
- 250 S Reynolds St Unit 1209
- 250 S Reynolds St Unit 111
- 250 S Reynolds St Unit 810
- 250 S Reynolds St Unit 1207
- 250 S Reynolds St Unit 1009
- 427 Nottoway Walk
- 475 Cameron Station Blvd
- 435 Cameron Station Blvd
- 60 S Van Dorn St Unit 116
- 247 S S Pickett St S Unit 302
- 245 S Pickett St Unit 202
- 261 S Pickett St Unit 302
- 16 S Van Dorn St Unit 503
- 16 S Van Dorn St Unit 604
- 5911 Edsall Rd Unit 903
- 5911 Edsall Rd Unit 814