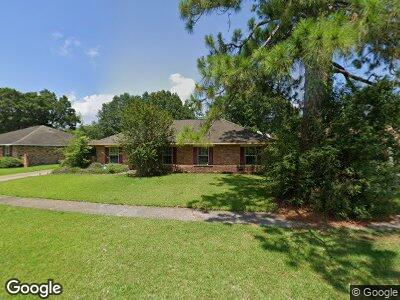
3770 White Sands Dr Baton Rouge, LA 70814
Park Forest/LA North NeighborhoodEstimated Value: $188,500 - $221,000
4
Beds
2
Baths
1,504
Sq Ft
$137/Sq Ft
Est. Value
About This Home
This home is located at 3770 White Sands Dr, Baton Rouge, LA 70814 and is currently estimated at $206,125, approximately $137 per square foot. 3770 White Sands Dr is a home located in East Baton Rouge Parish with nearby schools including Park Forest Elementary School, Park Forest Middle School, and Belaire High School.
Ownership History
Date
Name
Owned For
Owner Type
Purchase Details
Closed on
Jul 11, 2006
Sold by
Singleton Shawn
Bought by
Taylor Alonzo
Current Estimated Value
Home Financials for this Owner
Home Financials are based on the most recent Mortgage that was taken out on this home.
Original Mortgage
$118,400
Interest Rate
6.66%
Mortgage Type
New Conventional
Purchase Details
Closed on
Jan 23, 2001
Sold by
Atac 1 Llc
Bought by
Green Tree Financial Servicing Corp
Purchase Details
Closed on
Jun 30, 2000
Sold by
Corporation Green Tree Financial Servicing
Bought by
Atac 1 Llc
Purchase Details
Closed on
Aug 31, 1999
Sold by
Green Tree Financial Servicing Corp
Bought by
Taylor Alonzo G
Home Financials for this Owner
Home Financials are based on the most recent Mortgage that was taken out on this home.
Original Mortgage
$62,910
Interest Rate
7.65%
Create a Home Valuation Report for This Property
The Home Valuation Report is an in-depth analysis detailing your home's value as well as a comparison with similar homes in the area
Home Values in the Area
Average Home Value in this Area
Purchase History
| Date | Buyer | Sale Price | Title Company |
|---|---|---|---|
| Taylor Alonzo | $148,000 | -- | |
| Green Tree Financial Servicing Corp | $972 | -- | |
| Atac 1 Llc | $868 | -- | |
| Taylor Alonzo G | $69,900 | -- |
Source: Public Records
Mortgage History
| Date | Status | Borrower | Loan Amount |
|---|---|---|---|
| Open | Taylor Alonzo G | $86,700 | |
| Closed | Taylor Alonzo G | $108,800 | |
| Closed | Taylor Alonzo | $118,400 | |
| Previous Owner | Taylor Alonzo G | $62,910 |
Source: Public Records
Tax History Compared to Growth
Tax History
| Year | Tax Paid | Tax Assessment Tax Assessment Total Assessment is a certain percentage of the fair market value that is determined by local assessors to be the total taxable value of land and additions on the property. | Land | Improvement |
|---|---|---|---|---|
| 2024 | $1,020 | $14,800 | $1,500 | $13,300 |
| 2023 | $1,020 | $14,800 | $1,500 | $13,300 |
| 2022 | $1,842 | $14,800 | $1,500 | $13,300 |
| 2021 | $1,802 | $14,800 | $1,500 | $13,300 |
| 2020 | $1,823 | $14,800 | $1,500 | $13,300 |
| 2019 | $1,903 | $14,800 | $1,500 | $13,300 |
| 2018 | $1,881 | $14,800 | $1,500 | $13,300 |
| 2017 | $1,881 | $14,800 | $1,500 | $13,300 |
| 2016 | $487 | $10,145 | $1,500 | $8,645 |
| 2015 | $1,044 | $14,800 | $1,500 | $13,300 |
| 2014 | $1,041 | $14,800 | $1,500 | $13,300 |
| 2013 | -- | $14,800 | $1,500 | $13,300 |
Source: Public Records
Map
Nearby Homes
- 3825 Lassen Dr
- 3524 Redlands Dr
- 3860 Edgemont Dr
- 3462 E Forest Dr
- 3468 Ridgemont Dr
- 11222 Big Bend Ave
- 4538 Lassen Dr
- 3498 Aletha Dr
- 10554 Greenwell Springs Rd
- 10770 Greenwell Springs Rd
- 3923 Aletha Dr
- 3526 Platt Dr
- 11575 Biscayne Dr
- 4037 Sarasota Dr
- 9722 E Swingalong Ave
- 11953 E Banofax Ave
- 9751 Greenwell Springs Rd
- 3523 Yosemite Dr
- TBD Green Ridge Dr
- 4675 Coral Dr