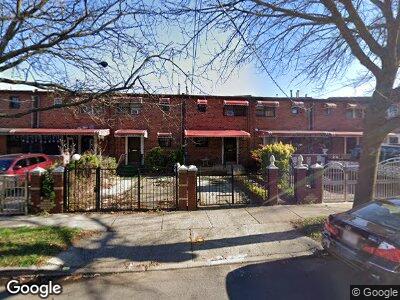
379 Wyona St Brooklyn, NY 11207
East New York NeighborhoodEstimated Value: $535,673 - $606,000
--
Bed
--
Bath
1,134
Sq Ft
$499/Sq Ft
Est. Value
About This Home
This home is located at 379 Wyona St, Brooklyn, NY 11207 and is currently estimated at $566,168, approximately $499 per square foot. 379 Wyona St is a home located in Kings County with nearby schools including P.S. 149 Danny Kaye, J.H.S 292 Margaret S. Douglas, and Achievement First - East New York School.
Create a Home Valuation Report for This Property
The Home Valuation Report is an in-depth analysis detailing your home's value as well as a comparison with similar homes in the area
Home Values in the Area
Average Home Value in this Area
Tax History Compared to Growth
Tax History
| Year | Tax Paid | Tax Assessment Tax Assessment Total Assessment is a certain percentage of the fair market value that is determined by local assessors to be the total taxable value of land and additions on the property. | Land | Improvement |
|---|---|---|---|---|
| 2024 | $1,041 | $34,320 | $13,260 | $21,060 |
| 2023 | $1,062 | $34,320 | $13,260 | $21,060 |
| 2022 | $883 | $32,160 | $13,260 | $18,900 |
| 2021 | $1,976 | $24,840 | $13,260 | $11,580 |
| 2020 | $1,020 | $24,660 | $13,260 | $11,400 |
| 2019 | $907 | $24,660 | $13,260 | $11,400 |
| 2018 | $781 | $14,126 | $6,450 | $7,676 |
| 2017 | $712 | $13,327 | $7,917 | $5,410 |
| 2016 | $703 | $13,250 | $8,562 | $4,688 |
| 2015 | $1,183 | $13,224 | $9,012 | $4,212 |
| 2014 | $1,183 | $12,477 | $7,527 | $4,950 |
Source: Public Records
Map
Nearby Homes
- 380 Bradford St
- 412 Bradford St
- 440 Miller Ave
- 342 Wyona St
- 410 Vermont St
- 414 Miller Ave
- 443 Miller Ave
- 667 Sutter Ave
- 663 Sutter Ave
- 444 New Jersey Ave
- 358 van Siclen Ave
- 353 Pennsylvania Ave
- 385 van Siclen Ave
- 380 Miller Ave
- 470 Wyona St
- 297 Pennsylvania Ave
- 537 Miller Ave
- 291 Granville Payne Ave
- 311 Sheffield Ave
- 2210 Pitkin Ave