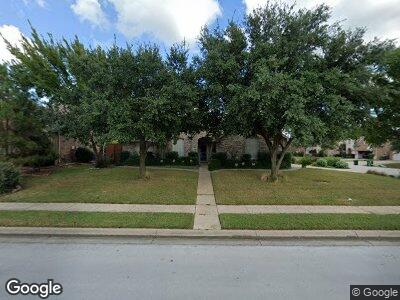
3800 Sandlin St Southlake, TX 76092
Estimated Value: $807,000 - $945,000
4
Beds
2
Baths
2,887
Sq Ft
$294/Sq Ft
Est. Value
About This Home
This home is located at 3800 Sandlin St, Southlake, TX 76092 and is currently estimated at $850,119, approximately $294 per square foot. 3800 Sandlin St is a home located in Tarrant County with nearby schools including Jack D. Johnson Elementary, Don T. Durham Intermediate School, and Carroll Middle School.
Ownership History
Date
Name
Owned For
Owner Type
Purchase Details
Closed on
Jan 17, 2018
Sold by
Fuller Robert R and Rawson Joan R
Bought by
Fuller Robert R and Rawson Joan R
Current Estimated Value
Purchase Details
Closed on
Nov 26, 2008
Sold by
Fuller Robert R
Bought by
Fuller Robert R and Rawson Joan R
Home Financials for this Owner
Home Financials are based on the most recent Mortgage that was taken out on this home.
Original Mortgage
$283,500
Interest Rate
6.08%
Mortgage Type
Stand Alone Refi Refinance Of Original Loan
Purchase Details
Closed on
Dec 29, 2004
Sold by
Mercedes Homes Of Texas Ltd
Bought by
Fuller Robert R
Home Financials for this Owner
Home Financials are based on the most recent Mortgage that was taken out on this home.
Original Mortgage
$234,544
Interest Rate
5.71%
Mortgage Type
Purchase Money Mortgage
Create a Home Valuation Report for This Property
The Home Valuation Report is an in-depth analysis detailing your home's value as well as a comparison with similar homes in the area
Home Values in the Area
Average Home Value in this Area
Purchase History
| Date | Buyer | Sale Price | Title Company |
|---|---|---|---|
| Fuller Robert R | -- | None Available | |
| Fuller Robert R | -- | First American | |
| Fuller Robert R | -- | B D R Title |
Source: Public Records
Mortgage History
| Date | Status | Borrower | Loan Amount |
|---|---|---|---|
| Open | Robert R Fuller Revocable Trus | $1,222,500 | |
| Closed | Robert R Fuller Revocable Trus | $1,222,500 | |
| Closed | Fuller Robert R | $278,046 | |
| Closed | Fuller Robert R | $288,000 | |
| Closed | Fuller Robert R | $283,500 | |
| Closed | Fuller Robert R | $234,544 | |
| Closed | Fuller Robert R | $58,636 |
Source: Public Records
Tax History Compared to Growth
Tax History
| Year | Tax Paid | Tax Assessment Tax Assessment Total Assessment is a certain percentage of the fair market value that is determined by local assessors to be the total taxable value of land and additions on the property. | Land | Improvement |
|---|---|---|---|---|
| 2024 | $2,748 | $817,583 | $203,100 | $614,483 |
| 2023 | $3,965 | $665,101 | $203,100 | $462,001 |
| 2022 | $12,391 | $617,965 | $135,400 | $482,565 |
| 2021 | $11,746 | $544,397 | $135,400 | $408,997 |
| 2020 | $10,844 | $514,410 | $121,860 | $392,550 |
| 2019 | $10,270 | $498,894 | $125,000 | $373,894 |
| 2018 | $5,163 | $412,441 | $121,860 | $290,581 |
| 2017 | $8,646 | $374,946 | $67,700 | $307,246 |
| 2016 | $9,032 | $393,890 | $67,700 | $326,190 |
| 2015 | $5,774 | $375,508 | $40,000 | $335,508 |
| 2014 | $5,774 | $323,700 | $40,000 | $283,700 |
Source: Public Records
Map
Nearby Homes
- 3512 S Gravel Cir
- 3549 N Gravel Cir
- 3509 Ferguson Rd
- 3325 Ferguson Rd
- 3321 Ferguson Rd
- 3401 Witt Ct
- 2606 Freeman Ct
- 2477 Lonesome Dove Rd
- 3055 Midway Rd
- 1305 Powder River Trail
- 2941 Flamingo Cir
- 1302 Powder River Trail
- 3061 Flamingo Cir
- 3300 Jackson Ct
- 3211 Foxfire Ln
- 1099 Burney Ln
- 1497 E Dove Rd
- 1145 E Dove Rd
- 2936 Peninsula Dr
- 3411 Red Bird Ln