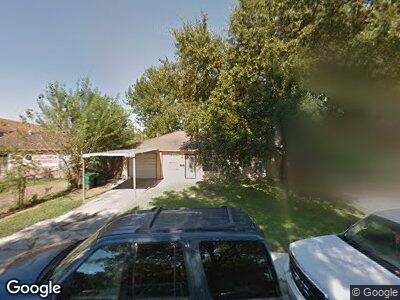
3807 Glenmore Dr Houston, TX 77023
Gulfgate-Pine Valley NeighborhoodEstimated Value: $210,000 - $224,000
3
Beds
2
Baths
1,286
Sq Ft
$169/Sq Ft
Est. Value
About This Home
This home is located at 3807 Glenmore Dr, Houston, TX 77023 and is currently estimated at $217,769, approximately $169 per square foot. 3807 Glenmore Dr is a home located in Harris County with nearby schools including Brookline Elementary School, Yolanda Black Navarro Middle School, and Austin High School.
Ownership History
Date
Name
Owned For
Owner Type
Purchase Details
Closed on
Mar 15, 2011
Sold by
The Bank Of New York Mellon Trust Compan
Bought by
Capulin Salvador and Capulin Cheli
Current Estimated Value
Purchase Details
Closed on
Nov 19, 2010
Sold by
Degollado Edilberto
Bought by
The Bank Of New York Mellon Trust Compan and The Bank Of New York Trust Company Na
Purchase Details
Closed on
Sep 5, 2003
Sold by
Robledo Rogelio and Robledo Rosa Nelia
Bought by
Degollado Edilberto
Home Financials for this Owner
Home Financials are based on the most recent Mortgage that was taken out on this home.
Original Mortgage
$88,500
Interest Rate
4.7%
Mortgage Type
Purchase Money Mortgage
Purchase Details
Closed on
Jan 17, 1997
Sold by
Wolf E P and Wolf Edward P
Bought by
Robledo Rogelio and Robledo Rosa Nelia
Purchase Details
Closed on
Dec 9, 1993
Sold by
Nowlin Mary D and Nowlin Mary D
Bought by
Robledo Rogelio and Robledo Rosa Nelia
Create a Home Valuation Report for This Property
The Home Valuation Report is an in-depth analysis detailing your home's value as well as a comparison with similar homes in the area
Home Values in the Area
Average Home Value in this Area
Purchase History
| Date | Buyer | Sale Price | Title Company |
|---|---|---|---|
| Capulin Salvador | -- | Lsi Title Agency Inc | |
| The Bank Of New York Mellon Trust Compan | $51,350 | None Available | |
| Degollado Edilberto | -- | Startex Title Company Llc | |
| Robledo Rogelio | -- | American Title Co | |
| Robledo Rogelio | -- | Stewart Title Co |
Source: Public Records
Mortgage History
| Date | Status | Borrower | Loan Amount |
|---|---|---|---|
| Previous Owner | Degollado Edilberto | $88,500 | |
| Previous Owner | Degollado Edilberto | $88,500 |
Source: Public Records
Tax History Compared to Growth
Tax History
| Year | Tax Paid | Tax Assessment Tax Assessment Total Assessment is a certain percentage of the fair market value that is determined by local assessors to be the total taxable value of land and additions on the property. | Land | Improvement |
|---|---|---|---|---|
| 2023 | $4,383 | $261,833 | $58,286 | $203,547 |
| 2022 | $5,049 | $229,287 | $58,286 | $171,001 |
| 2021 | $3,851 | $165,229 | $58,286 | $106,943 |
| 2020 | $2,943 | $121,549 | $49,319 | $72,230 |
| 2019 | $2,725 | $107,671 | $38,857 | $68,814 |
| 2018 | $2,225 | $87,924 | $26,901 | $61,023 |
| 2017 | $2,223 | $87,924 | $26,901 | $61,023 |
| 2016 | $2,223 | $87,924 | $26,901 | $61,023 |
| 2015 | $2,028 | $87,924 | $26,901 | $61,023 |
| 2014 | $2,028 | $78,906 | $26,901 | $52,005 |
Source: Public Records
Map
Nearby Homes
- 3231 Real St Unit A/B
- 3243 Real St Unit A/B
- 4018 Antoinette St
- 4042 Wynona St
- 4131 Grimes St
- 4118 Antoinette St
- 2705 Beatty St
- 2915 Lidstone St
- 2960 Pitzlin St
- 4134 Antoinette St
- 4129 Grimes St
- 3223 Pecan St
- 3139 Pecan St
- 6402 Stratton St
- 5307 Pomander Rd
- 5318 Cortelyou Ln
- 5230 Stuyvesant Ln
- 5315 Newkirk Ln
- 5218 Penfield Ln
- 6723 South Loop E