
Seller's Agent in 2024
Wendy Mitchel
Choice Residential Real Estate
(919) 749-0536
67 Total Sales
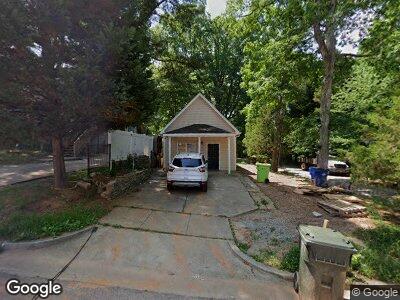
Looking for a cozy and convenient place to call home near North Carolina State University? This charming single-family, 2-bedroom home offers the perfect blend of comfort, space, and proximity to campus! Located just minutes from NCSU, shopping, and local dining, this property is ideal for students, professionals, or anyone seeking a relaxed lifestyle close to everything.
Key Features:
Spacious Yard: Enjoy the outdoors with a large, well-maintained yard perfect for weekend gatherings, gardening, or just relaxing in the sun!
Fenced-In Area: Ideal for pet owners or added privacy, the fenced-in section is a great bonus for pets or extra security.
Ample Parking: With plenty of parking space, you'll never have to worry about finding a spot.
Dont miss out on this opportunity to live in a comfortable, conveniently located home near NCSU. Schedule a showing today!
| Date | Buyer | Sale Price | Title Company |
|---|---|---|---|
| Mangari Land Solutions Llc | $335,000 | None Listed On Document | |
| Martinez Eric | $275,000 | Capital City Law | |
| Bost James L | -- | None Available | |
| Bost James L | $25,000 | -- |
| Date | Status | Borrower | Loan Amount |
|---|---|---|---|
| Open | Mangari Land Solutions Llc | $595,000 | |
| Previous Owner | Martinez Eric | $261,250 |
| Date | Event | Price | Change | Sq Ft Price |
|---|---|---|---|---|
| 11/19/2024 11/19/24 | Rented | $1,800 | 0.0% | -- |
| 11/04/2024 11/04/24 | For Rent | $1,800 | 0.0% | -- |
| 10/30/2024 10/30/24 | Sold | $335,000 | -4.3% | $342 / Sq Ft |
| 09/23/2024 09/23/24 | Pending | -- | -- | -- |
| 09/03/2024 09/03/24 | For Sale | $350,000 | +27.3% | $357 / Sq Ft |
| 12/15/2023 12/15/23 | Off Market | $275,000 | -- | -- |
| 02/28/2022 02/28/22 | Sold | $275,000 | -8.0% | $291 / Sq Ft |
| 01/08/2022 01/08/22 | Pending | -- | -- | -- |
| 01/01/2022 01/01/22 | For Sale | $299,000 | -- | $316 / Sq Ft |
| Year | Tax Paid | Tax Assessment Tax Assessment Total Assessment is a certain percentage of the fair market value that is determined by local assessors to be the total taxable value of land and additions on the property. | Land | Improvement |
|---|---|---|---|---|
| 2024 | $2,637 | $301,378 | $165,000 | $136,378 |
| 2023 | $2,268 | $206,203 | $96,000 | $110,203 |
| 2022 | $2,108 | $206,203 | $96,000 | $110,203 |
| 2021 | $2,026 | $206,203 | $96,000 | $110,203 |
| 2020 | $1,990 | $206,203 | $96,000 | $110,203 |
| 2019 | $1,808 | $154,306 | $72,000 | $82,306 |
| 2018 | $1,706 | $154,306 | $72,000 | $82,306 |
| 2017 | $1,625 | $154,306 | $72,000 | $82,306 |
| 2016 | $1,592 | $154,306 | $72,000 | $82,306 |
| 2015 | $1,604 | $152,989 | $72,000 | $80,989 |
| 2014 | $1,522 | $152,989 | $72,000 | $80,989 |
Seller's Agent in 2024
Wendy Mitchel
Choice Residential Real Estate
(919) 749-0536
67 Total Sales
Seller's Agent in 2024
David Mang
Rich Realty Group
(919) 757-3652
88 Total Sales
A
Buyer's Agent in 2024
Arya Asgari
Rich Realty Group
(919) 434-9848
21 Total Sales
J
Seller's Agent in 2022
Joseph Hodge
Hodge & Kittrell Sotheby's Int
(919) 818-2071
95 Total Sales
Buyer's Agent in 2022
Keith Bowden
NorthGroup Real Estate, Inc.
(919) 272-7105
15 Total Sales