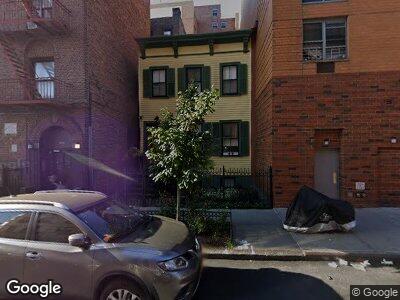
386 E 162nd St Bronx, NY 10451
Melrose NeighborhoodEstimated Value: $669,854 - $938,000
--
Bed
--
Bath
2,016
Sq Ft
$384/Sq Ft
Est. Value
About This Home
This home is located at 386 E 162nd St, Bronx, NY 10451 and is currently estimated at $773,464, approximately $383 per square foot. 386 E 162nd St is a home located in Bronx County with nearby schools including P.S. 35 Franz Siegel, Jhs 22 Jordan L Mott, and Success Academy Charter School-Bronx 3.
Ownership History
Date
Name
Owned For
Owner Type
Purchase Details
Closed on
Mar 22, 2017
Sold by
Bloomfield Steven Joel
Bought by
Bloomfield As Trustee, Steven Joel
Current Estimated Value
Home Financials for this Owner
Home Financials are based on the most recent Mortgage that was taken out on this home.
Original Mortgage
$9,110
Outstanding Balance
$7,779
Interest Rate
4.23%
Mortgage Type
Purchase Money Mortgage
Estimated Equity
$749,313
Purchase Details
Closed on
Dec 28, 2015
Sold by
Bloomfield Steven
Bought by
Steven Joel Bloomfield Trust
Purchase Details
Closed on
Jun 5, 2009
Sold by
Lozowski Mary C
Bought by
Bloomfield Steven
Home Financials for this Owner
Home Financials are based on the most recent Mortgage that was taken out on this home.
Original Mortgage
$346,794
Interest Rate
4.91%
Mortgage Type
Purchase Money Mortgage
Create a Home Valuation Report for This Property
The Home Valuation Report is an in-depth analysis detailing your home's value as well as a comparison with similar homes in the area
Home Values in the Area
Average Home Value in this Area
Purchase History
| Date | Buyer | Sale Price | Title Company |
|---|---|---|---|
| Bloomfield As Trustee, Steven Joel | -- | -- | |
| Bloomfield Steven Joel | -- | -- | |
| Steven Joel Bloomfield Trust | -- | -- | |
| Bloomfield Steven | $185,000 | -- |
Source: Public Records
Mortgage History
| Date | Status | Borrower | Loan Amount |
|---|---|---|---|
| Open | Bloomfield Steven Joel | $9,110 | |
| Previous Owner | Bloomfield Steven | $325,320 | |
| Previous Owner | Bloomfield Steven | $346,794 |
Source: Public Records
Tax History Compared to Growth
Tax History
| Year | Tax Paid | Tax Assessment Tax Assessment Total Assessment is a certain percentage of the fair market value that is determined by local assessors to be the total taxable value of land and additions on the property. | Land | Improvement |
|---|---|---|---|---|
| 2024 | $1,316 | $7,951 | $2,136 | $5,815 |
| 2023 | $1,243 | $7,520 | $2,269 | $5,251 |
| 2022 | $1,214 | $38,040 | $11,460 | $26,580 |
| 2021 | $1,261 | $33,540 | $11,460 | $22,080 |
| 2020 | $1,189 | $36,420 | $11,460 | $24,960 |
| 2019 | $1,093 | $33,540 | $11,460 | $22,080 |
| 2018 | $980 | $6,267 | $1,827 | $4,440 |
| 2017 | $978 | $6,267 | $2,520 | $3,747 |
| 2016 | $929 | $6,195 | $2,606 | $3,589 |
| 2015 | $493 | $5,846 | $2,408 | $3,438 |
| 2014 | $493 | $5,522 | $2,373 | $3,149 |
Source: Public Records
Map
Nearby Homes
- 400 E 161 St Unit 5D
- 838 Courtlandt Ave
- 943 Teller Ave Unit 3A
- 837 Washington Ave Unit 7K
- 837 Washington Ave Unit 2G
- 837 Washington Ave Unit 8C
- 837 Washington Ave Unit 3A
- 837 Washington Ave Unit 7C
- 323 E 158th St
- 782 Brook Ave Unit 30D
- 736 Elton Ave
- 3044 3rd Ave Unit 4E
- 3044 3rd Ave Unit 6F
- 514 E 159th St Unit A
- 1037 College Ave
- 902 Eagle Ave Unit 2
- 758 Brook Ave Unit 56C
- 1046 Morris Ave
- 755 Saint Anns Ave Unit 53B
- 769 Saint Ann's Ave Unit 42D