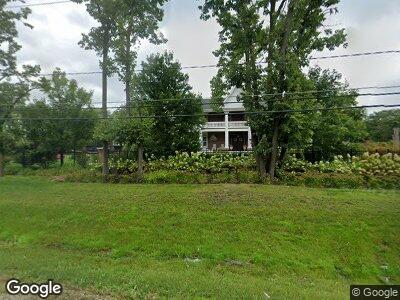
388 S Saint Marys Rd Libertyville, IL 60048
Mettawa NeighborhoodEstimated Value: $1,784,076 - $2,396,000
--
Bed
3
Baths
2,942
Sq Ft
$710/Sq Ft
Est. Value
About This Home
This home is located at 388 S Saint Marys Rd, Libertyville, IL 60048 and is currently estimated at $2,090,038, approximately $710 per square foot. 388 S Saint Marys Rd is a home located in Lake County with nearby schools including Rondout Elementary School, Libertyville High School, and St Joseph Catholic School.
Ownership History
Date
Name
Owned For
Owner Type
Purchase Details
Closed on
Mar 19, 2018
Sold by
Stokovich Debra A and Stokovich Nicholas
Bought by
Stokovich Debra A and Debra A Stokovich Trust
Current Estimated Value
Purchase Details
Closed on
Mar 16, 2018
Sold by
Stokovich Debra A and Stokovich Nicholas
Bought by
Stokovich Debra A and Debra A Stokovich Trust
Purchase Details
Closed on
Apr 29, 2005
Sold by
Wayne Hummer Trust Co Na
Bought by
Stokovich Nicholas and Stokovich Debra A
Purchase Details
Closed on
Dec 27, 1999
Sold by
Stokovich Enterprises Llc
Bought by
Declaration Stokovich Dorothy and Dorothy Stokovich Declaration Of Trust
Purchase Details
Closed on
Dec 23, 1999
Sold by
Declaration Stokovich Dorothy
Bought by
Stokovich Enterprises Llc
Purchase Details
Closed on
Oct 14, 1992
Sold by
Stokovich Slavko and Stokovich Dorothy
Bought by
Stokovich Dorothy
Create a Home Valuation Report for This Property
The Home Valuation Report is an in-depth analysis detailing your home's value as well as a comparison with similar homes in the area
Home Values in the Area
Average Home Value in this Area
Purchase History
| Date | Buyer | Sale Price | Title Company |
|---|---|---|---|
| Stokovich Debra A | -- | None Available | |
| Stokovich Debra A | -- | None Available | |
| Stokovich Nicholas | $800,000 | Ct | |
| Declaration Stokovich Dorothy | -- | -- | |
| Stokovich Enterprises Llc | -- | -- |
Source: Public Records
Mortgage History
| Date | Status | Borrower | Loan Amount |
|---|---|---|---|
| Closed | Debra A Stokovich Trust | $1,500,000 | |
| Closed | Stokovich Nicholas | $5,000,000 |
Source: Public Records
Tax History Compared to Growth
Tax History
| Year | Tax Paid | Tax Assessment Tax Assessment Total Assessment is a certain percentage of the fair market value that is determined by local assessors to be the total taxable value of land and additions on the property. | Land | Improvement |
|---|---|---|---|---|
| 2023 | $61,328 | $1,075,494 | $181,092 | $894,402 |
| 2022 | $61,328 | $933,953 | $174,060 | $759,893 |
| 2021 | $54,700 | $913,848 | $170,313 | $743,535 |
| 2020 | $53,246 | $898,484 | $167,450 | $731,034 |
| 2019 | $53,246 | $889,941 | $165,858 | $724,083 |
| 2018 | $59,495 | $1,006,856 | $182,598 | $824,258 |
| 2017 | $35,784 | $590,401 | $176,834 | $413,567 |
| 2016 | $34,270 | $559,781 | $167,663 | $392,118 |
| 2015 | $33,867 | $523,209 | $156,709 | $366,500 |
| 2014 | $33,299 | $516,188 | $154,606 | $361,582 |
| 2012 | $32,594 | $520,666 | $155,947 | $364,719 |
Source: Public Records
Map
Nearby Homes
- 15105 W Rockland Rd
- 1233 Ashbury Ln
- 609 Riverside Dr
- 15160 W Oak Spring Rd
- 751 Kenwood Ave
- 401 7th Ave
- 28010 N Bradley Rd
- 1375 Atkinson Rd
- 27912 N Bradley Rd
- 724 E Sunnyside Ave
- 523 Buckingham Place
- 395 Fox Run Rd
- 901 Bruce Ct
- 616 Meadow Ln
- 520 E Lincoln Ave
- 215 5th St Unit 215
- 608 Ardmore Terrace
- 14341 W Old School Rd
- 121 4th St
- 0 E Sunnyside Ave