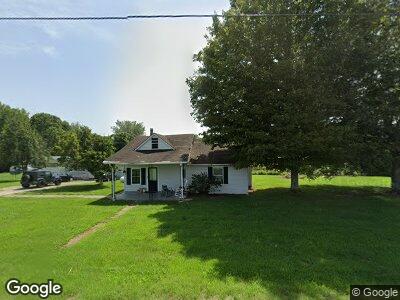
389 Jc Farm Ln Estill Springs, TN 37330
Estimated Value: $681,000 - $1,025,000
3
Beds
3
Baths
3,083
Sq Ft
$281/Sq Ft
Est. Value
About This Home
This home is located at 389 Jc Farm Ln, Estill Springs, TN 37330 and is currently estimated at $867,063, approximately $281 per square foot. 389 Jc Farm Ln is a home located in Franklin County with nearby schools including North Middle School and Franklin County High School.
Ownership History
Date
Name
Owned For
Owner Type
Purchase Details
Closed on
Sep 21, 2020
Sold by
Robertson Phillip L and Robertson Shirley D
Bought by
Frame Anthony
Current Estimated Value
Purchase Details
Closed on
Sep 18, 2015
Sold by
Vonsande David M
Bought by
Farris Jason and Farris Christen M
Purchase Details
Closed on
Jun 5, 1980
Bought by
Vonsande David M and Vonsande Helen J
Purchase Details
Closed on
Jan 1, 1980
Create a Home Valuation Report for This Property
The Home Valuation Report is an in-depth analysis detailing your home's value as well as a comparison with similar homes in the area
Home Values in the Area
Average Home Value in this Area
Purchase History
| Date | Buyer | Sale Price | Title Company |
|---|---|---|---|
| Frame Anthony | $7,500 | None Available | |
| Farris Jason | $285,000 | -- | |
| Vonsande David M | -- | -- | |
| -- | $55,000 | -- |
Source: Public Records
Mortgage History
| Date | Status | Borrower | Loan Amount |
|---|---|---|---|
| Open | Farris Jason | $266,000 | |
| Closed | Farris Jason | $274,750 | |
| Previous Owner | Farris Jason | $301,400 | |
| Previous Owner | Farris Jason | $300,000 | |
| Previous Owner | Farris Jason | $50,000 | |
| Previous Owner | Vonsande David M | $17,150 |
Source: Public Records
Tax History Compared to Growth
Tax History
| Year | Tax Paid | Tax Assessment Tax Assessment Total Assessment is a certain percentage of the fair market value that is determined by local assessors to be the total taxable value of land and additions on the property. | Land | Improvement |
|---|---|---|---|---|
| 2024 | $3,587 | $179,775 | $23,100 | $156,675 |
| 2023 | $3,587 | $179,775 | $23,100 | $156,675 |
| 2022 | $3,371 | $179,775 | $23,100 | $156,675 |
| 2021 | $3,423 | $179,775 | $23,100 | $156,675 |
| 2020 | $1,038 | $118,925 | $17,575 | $101,350 |
| 2019 | $1,038 | $36,075 | $17,575 | $18,500 |
| 2018 | $840 | $36,075 | $17,575 | $18,500 |
| 2017 | $847 | $31,675 | $14,775 | $16,900 |
| 2016 | $680 | $25,425 | $10,925 | $14,500 |
| 2015 | $680 | $25,425 | $10,925 | $14,500 |
| 2014 | $679 | $25,408 | $0 | $0 |
Source: Public Records
Map
Nearby Homes
- 796 Highland Ridge Rd
- 667 Highland Ridge Rd
- 0 Damron Rd Unit RTC2819420
- 452 Evans Dr
- 0 Caldwell Dr Unit RTC2818818
- 0 Caldwell Dr Unit RTC2769017
- 0 Hasty Ln Unit RTC2785762
- 1 Hasty Ln
- 215 Evans Dr
- 199 Evans Dr
- 301 Evans Dr
- 264 Evans Dr
- 807 Hasty Ln
- 835 Hasty Ln
- 340 Evans Dr
- 891 Hasty Ln
- 505 Evans Dr
- 400 Evans Dr
- 460 Evans Dr
- 1378 Pleasant Grove Rd