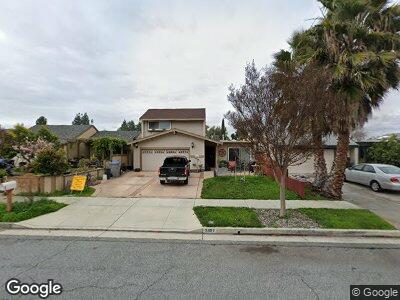
3897 Tiverton Dr San Jose, CA 95121
Ramblewood NeighborhoodEstimated Value: $1,080,000 - $1,247,000
2
Beds
2
Baths
1,619
Sq Ft
$726/Sq Ft
Est. Value
About This Home
This home is located at 3897 Tiverton Dr, San Jose, CA 95121 and is currently estimated at $1,175,747, approximately $726 per square foot. 3897 Tiverton Dr is a home located in Santa Clara County with nearby schools including Ramblewood Elementary School, Sylvandale Middle School, and Andrew P. Hill High School.
Ownership History
Date
Name
Owned For
Owner Type
Purchase Details
Closed on
Aug 30, 2007
Sold by
Wolfe Kane B and Wolfe Tammie L
Bought by
Wolfe Kane B and Wolfe Tammie L
Current Estimated Value
Home Financials for this Owner
Home Financials are based on the most recent Mortgage that was taken out on this home.
Original Mortgage
$310,000
Interest Rate
6.67%
Mortgage Type
New Conventional
Purchase Details
Closed on
Feb 15, 2000
Sold by
Travelstead Robert A
Bought by
Wolfe Kane B and Wolfe Tammie L
Home Financials for this Owner
Home Financials are based on the most recent Mortgage that was taken out on this home.
Original Mortgage
$220,000
Interest Rate
7.45%
Purchase Details
Closed on
May 12, 1994
Sold by
Travelstead David E
Bought by
Travelstead Robert A and Travelstead Phyllis M
Home Financials for this Owner
Home Financials are based on the most recent Mortgage that was taken out on this home.
Original Mortgage
$145,300
Interest Rate
4.12%
Create a Home Valuation Report for This Property
The Home Valuation Report is an in-depth analysis detailing your home's value as well as a comparison with similar homes in the area
Home Values in the Area
Average Home Value in this Area
Purchase History
| Date | Buyer | Sale Price | Title Company |
|---|---|---|---|
| Wolfe Kane B | -- | Financial Title | |
| Wolfe Kane B | -- | Chicago Title Co | |
| Travelstead Robert A | $48,000 | Stewart Title |
Source: Public Records
Mortgage History
| Date | Status | Borrower | Loan Amount |
|---|---|---|---|
| Open | Wolfe Kane B | $310,000 | |
| Closed | Wolfe Kane B | $310,000 | |
| Closed | Wolfe Tammie L | $245,000 | |
| Closed | Travelstead Phyllis Marie | $220,000 | |
| Previous Owner | Travelstead Robert A | $145,300 |
Source: Public Records
Tax History Compared to Growth
Tax History
| Year | Tax Paid | Tax Assessment Tax Assessment Total Assessment is a certain percentage of the fair market value that is determined by local assessors to be the total taxable value of land and additions on the property. | Land | Improvement |
|---|---|---|---|---|
| 2023 | $6,643 | $393,288 | $170,701 | $222,587 |
| 2022 | $6,490 | $385,577 | $167,354 | $218,223 |
| 2021 | $6,424 | $378,018 | $164,073 | $213,945 |
| 2020 | $6,176 | $374,143 | $162,391 | $211,752 |
| 2019 | $5,922 | $366,807 | $159,207 | $207,600 |
| 2018 | $5,900 | $359,616 | $156,086 | $203,530 |
| 2017 | $5,819 | $352,566 | $153,026 | $199,540 |
| 2016 | $5,536 | $345,654 | $150,026 | $195,628 |
| 2015 | $5,422 | $340,463 | $147,773 | $192,690 |
| 2014 | $4,904 | $333,795 | $144,879 | $188,916 |
Source: Public Records
Map
Nearby Homes
- 1614 Rossburn Ct
- 1288 Isengard Ct
- 3820 Dove Hill Rd
- 3735 Ruther Place Way
- 933 Faris Dr
- 1711 Silver Meadow Ct
- 1725 Silver Glen Ct
- 1367 Trailside Ct Unit 13
- 1549 Meadow Glen Ct
- 1520 E Capitol Expy Unit 133
- 1520 E Capitol Expy Unit 8
- 1520 E Capitol Expy Unit 91
- 3495 Sugarcreek Dr
- 795 Nokomis Dr
- 714 River Park Dr
- 1120 Loupe Ave
- 1734 Bagpipe Way
- 1638 Heritage Bay Ct Unit 1
- 1832 Loch Ness Way
- 563 Groth Place