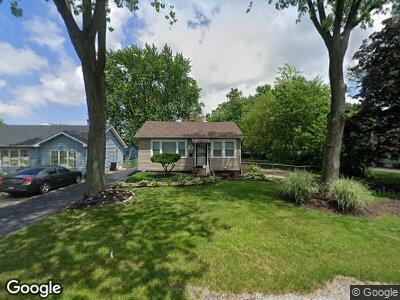
39 N State St Glenwood, IL 60425
Estimated Value: $145,000 - $207,000
2
Beds
1
Bath
1,100
Sq Ft
$156/Sq Ft
Est. Value
About This Home
This home is located at 39 N State St, Glenwood, IL 60425 and is currently estimated at $171,098, approximately $155 per square foot. 39 N State St is a home located in Cook County with nearby schools including Longwood Elementary School, Brookwood Middle School, and Brookwood Jr High School.
Ownership History
Date
Name
Owned For
Owner Type
Purchase Details
Closed on
May 31, 2017
Sold by
U S Bank Na
Bought by
P & I Unique Investment Corp
Current Estimated Value
Purchase Details
Closed on
Sep 8, 2016
Sold by
Leday Christine D
Bought by
U S Bank Na and U S Bank National Association Nd
Purchase Details
Closed on
Jul 10, 2007
Sold by
Hayes Joyce K
Bought by
Leday Christine D and The Joyce K Hayes Trust #1
Purchase Details
Closed on
Jun 20, 2001
Sold by
Federal National Mortgage Association
Bought by
Hayes Joyce K
Home Financials for this Owner
Home Financials are based on the most recent Mortgage that was taken out on this home.
Original Mortgage
$42,799
Interest Rate
7.03%
Purchase Details
Closed on
Dec 4, 2000
Sold by
Kanger James C
Bought by
Federal National Mortgage Association
Purchase Details
Closed on
May 3, 1999
Sold by
Kanger Tami
Bought by
Kanger James
Create a Home Valuation Report for This Property
The Home Valuation Report is an in-depth analysis detailing your home's value as well as a comparison with similar homes in the area
Home Values in the Area
Average Home Value in this Area
Purchase History
| Date | Buyer | Sale Price | Title Company |
|---|---|---|---|
| P & I Unique Investment Corp | $22,000 | None Available | |
| U S Bank Na | -- | None Available | |
| Leday Christine D | -- | None Available | |
| Hayes Joyce K | -- | -- | |
| Federal National Mortgage Association | -- | -- | |
| Kanger James | -- | -- |
Source: Public Records
Mortgage History
| Date | Status | Borrower | Loan Amount |
|---|---|---|---|
| Previous Owner | Hayes Joyce K | $42,799 |
Source: Public Records
Tax History Compared to Growth
Tax History
| Year | Tax Paid | Tax Assessment Tax Assessment Total Assessment is a certain percentage of the fair market value that is determined by local assessors to be the total taxable value of land and additions on the property. | Land | Improvement |
|---|---|---|---|---|
| 2024 | $3,488 | $17,000 | $2,250 | $14,750 |
| 2023 | $3,488 | $17,000 | $2,250 | $14,750 |
| 2022 | $3,488 | $6,505 | $1,875 | $4,630 |
| 2021 | $3,467 | $6,505 | $1,875 | $4,630 |
| 2020 | $3,465 | $6,505 | $1,875 | $4,630 |
| 2019 | $4,664 | $8,577 | $1,687 | $6,890 |
| 2018 | $4,434 | $8,577 | $1,687 | $6,890 |
| 2017 | $4,472 | $8,577 | $1,687 | $6,890 |
| 2016 | $4,056 | $7,667 | $1,500 | $6,167 |
| 2015 | $3,934 | $7,667 | $1,500 | $6,167 |
| 2014 | $3,866 | $7,667 | $1,500 | $6,167 |
| 2013 | $4,078 | $8,946 | $1,500 | $7,446 |
Source: Public Records
Map
Nearby Homes
- 113 N Rebecca St
- 7 N State St
- 32 E Center St
- 14 W Main St
- 126 S Campbell Ave
- 110 N Oak Ln
- 216 E Maple Dr
- 19 N Elm Ln
- 208 E Mulberry Dr
- 118 N Pine Ln
- 301 E Maple Dr
- 108 Campbell Ave
- 304 E Birch Dr
- 304 E Center St
- 40 N Sycamore Ln
- 120 S Chestnut Ln
- 401 N Pleasant Dr
- 423 N Pleasant Dr
- 406 N Park Dr
- 436 N Pleasant Dr