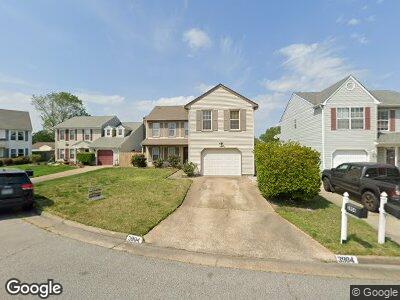
3904 Quartz Ln Virginia Beach, VA 23456
Landstown NeighborhoodEstimated Value: $418,909 - $452,000
4
Beds
3
Baths
2,104
Sq Ft
$206/Sq Ft
Est. Value
About This Home
This home is located at 3904 Quartz Ln, Virginia Beach, VA 23456 and is currently estimated at $433,727, approximately $206 per square foot. 3904 Quartz Ln is a home located in Virginia Beach City with nearby schools including Salem Elementary School, Landstown Middle School, and Landstown High School.
Ownership History
Date
Name
Owned For
Owner Type
Purchase Details
Closed on
Jun 14, 2023
Sold by
Pettaway Floyd C and Pettaway Catherine M
Bought by
Kuteyi Bamidele Moses and Kuteyi Tolulope
Current Estimated Value
Home Financials for this Owner
Home Financials are based on the most recent Mortgage that was taken out on this home.
Original Mortgage
$412,686
Outstanding Balance
$401,674
Interest Rate
4%
Mortgage Type
VA
Estimated Equity
$20,639
Purchase Details
Closed on
Apr 8, 2004
Sold by
Higgins Jerry C
Bought by
Pettaway Floyd C
Home Financials for this Owner
Home Financials are based on the most recent Mortgage that was taken out on this home.
Original Mortgage
$197,600
Interest Rate
5.58%
Mortgage Type
New Conventional
Purchase Details
Closed on
May 29, 2001
Sold by
Cabibbo Roy J
Bought by
Higgins Jerry C
Home Financials for this Owner
Home Financials are based on the most recent Mortgage that was taken out on this home.
Original Mortgage
$134,640
Interest Rate
7.09%
Create a Home Valuation Report for This Property
The Home Valuation Report is an in-depth analysis detailing your home's value as well as a comparison with similar homes in the area
Home Values in the Area
Average Home Value in this Area
Purchase History
| Date | Buyer | Sale Price | Title Company |
|---|---|---|---|
| Kuteyi Bamidele Moses | $404,000 | Priority Title & Escrow | |
| Pettaway Floyd C | $190,000 | -- | |
| Higgins Jerry C | $132,000 | -- |
Source: Public Records
Mortgage History
| Date | Status | Borrower | Loan Amount |
|---|---|---|---|
| Open | Kuteyi Bamidele Moses | $412,686 | |
| Previous Owner | Pettaway Floyd C | $178,000 | |
| Previous Owner | Pettaway Floyd C | $197,600 | |
| Previous Owner | Higgins Jerry C | $134,640 |
Source: Public Records
Tax History Compared to Growth
Tax History
| Year | Tax Paid | Tax Assessment Tax Assessment Total Assessment is a certain percentage of the fair market value that is determined by local assessors to be the total taxable value of land and additions on the property. | Land | Improvement |
|---|---|---|---|---|
| 2024 | $3,811 | $392,900 | $115,000 | $277,900 |
| 2023 | $3,634 | $367,100 | $108,000 | $259,100 |
| 2022 | $3,228 | $326,100 | $100,000 | $226,100 |
| 2021 | $2,833 | $286,200 | $86,000 | $200,200 |
| 2020 | $2,689 | $264,300 | $86,000 | $178,300 |
| 2019 | $2,639 | $258,300 | $85,000 | $173,300 |
| 2018 | $2,589 | $258,300 | $85,000 | $173,300 |
| 2017 | $2,455 | $244,900 | $85,000 | $159,900 |
| 2016 | $2,350 | $237,400 | $85,000 | $152,400 |
| 2015 | $2,357 | $238,100 | $85,000 | $153,100 |
| 2014 | $2,042 | $226,000 | $92,000 | $134,000 |
Source: Public Records
Map
Nearby Homes
- 1704 Pebble Place
- 3938 Morning Light Ln
- 3939 Morning Light Ln
- 1780 Petree Dr
- 3923 Lantana Place
- 4006 Salem Terrace
- 4044 Laurel Green Cir
- 4153 Laurel Green Cir Unit 4153
- 4125 Laurel Green Cir
- 4221 Laurel Green Cir
- 4209 Laurel Green Cir
- 5049 Heathglen Cir
- 3941 Topaz Ln
- 1725 Grand Bay Dr
- 4100 Starwood Arch
- 1848 Aquamarine Dr
- 3912 Kiwanis Loop
- 3809 Hazel Ct
- 1716 Star Ct
- 4128 Ardent Cir