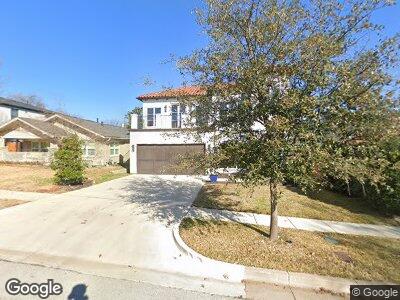
3904 W 5th St Fort Worth, TX 76107
Monticello NeighborhoodEstimated Value: $1,302,000 - $1,544,142
3
Beds
4
Baths
4,476
Sq Ft
$315/Sq Ft
Est. Value
About This Home
This home is located at 3904 W 5th St, Fort Worth, TX 76107 and is currently estimated at $1,407,786, approximately $314 per square foot. 3904 W 5th St is a home located in Tarrant County with nearby schools including North Hi Mount Elementary School, Stripling Middle School, and Arlington Heights High School.
Ownership History
Date
Name
Owned For
Owner Type
Purchase Details
Closed on
Nov 17, 2017
Sold by
Riveisdiel Homeblides Ltd
Bought by
Moore Stven
Current Estimated Value
Home Financials for this Owner
Home Financials are based on the most recent Mortgage that was taken out on this home.
Original Mortgage
$780,000
Outstanding Balance
$684,642
Interest Rate
5%
Mortgage Type
Adjustable Rate Mortgage/ARM
Estimated Equity
$836,718
Purchase Details
Closed on
Jun 13, 2016
Sold by
Farris Thomas Lee
Bought by
Riverside Homebuilders Ltd
Home Financials for this Owner
Home Financials are based on the most recent Mortgage that was taken out on this home.
Original Mortgage
$0
Interest Rate
3.57%
Mortgage Type
Stand Alone Second
Purchase Details
Closed on
Jul 5, 2007
Sold by
Welch Tamara Lynn
Bought by
The Geo Read Family Trust
Create a Home Valuation Report for This Property
The Home Valuation Report is an in-depth analysis detailing your home's value as well as a comparison with similar homes in the area
Home Values in the Area
Average Home Value in this Area
Purchase History
| Date | Buyer | Sale Price | Title Company |
|---|---|---|---|
| Moore Stven | -- | None Available | |
| Riverside Homebuilders Ltd | -- | Rtc | |
| The Geo Read Family Trust | -- | None Available |
Source: Public Records
Mortgage History
| Date | Status | Borrower | Loan Amount |
|---|---|---|---|
| Open | Moore Stven | $780,000 | |
| Previous Owner | Kiverside Homebuilders Ltd | $660,000 | |
| Previous Owner | Riverside Homebuilders Ltd | $0 |
Source: Public Records
Tax History Compared to Growth
Tax History
| Year | Tax Paid | Tax Assessment Tax Assessment Total Assessment is a certain percentage of the fair market value that is determined by local assessors to be the total taxable value of land and additions on the property. | Land | Improvement |
|---|---|---|---|---|
| 2024 | $19,548 | $1,154,357 | $177,000 | $977,357 |
| 2023 | $19,548 | $1,185,978 | $177,000 | $1,008,978 |
| 2022 | $25,266 | $1,013,252 | $177,000 | $836,252 |
| 2021 | $24,238 | $883,572 | $177,000 | $706,572 |
| 2020 | $26,729 | $1,009,867 | $177,000 | $832,867 |
| 2019 | $29,365 | $1,075,775 | $177,000 | $898,775 |
| 2018 | $26,695 | $970,429 | $200,000 | $770,429 |
| 2017 | $5,666 | $200,000 | $200,000 | $0 |
| 2016 | $6,387 | $225,456 | $200,000 | $25,456 |
| 2015 | $5,929 | $208,900 | $155,000 | $53,900 |
| 2014 | $5,929 | $208,900 | $155,000 | $53,900 |
Source: Public Records
Map
Nearby Homes
- 3904 W 6th St
- 3808 W 5th St
- 3778 W 5th St
- 3816 W 7th St
- 3801 Potomac Ave
- 3750 W 5th St
- 3758 W 7th St
- 3701 W 5th St
- 3727 Modlin Ave
- 3813 Mattison Ave
- 3612 W 5th St
- 4113 Modlin Ave
- 4063 Mattison Ave
- 3605 W 5th St
- 3920 Clarke Ave
- 400 Hazelwood Dr W
- 3717 Bunting Ave
- 1201 Virginia Place
- 501 Monticello Dr
- 1304 Belle Place