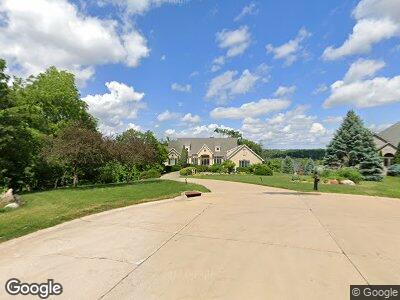
3918 Walnut Grove Ct NE Cedar Rapids, IA 52411
Estimated Value: $637,000 - $1,046,000
4
Beds
4
Baths
6,073
Sq Ft
$146/Sq Ft
Est. Value
About This Home
This home is located at 3918 Walnut Grove Ct NE, Cedar Rapids, IA 52411 and is currently estimated at $884,173, approximately $145 per square foot. 3918 Walnut Grove Ct NE is a home located in Linn County with nearby schools including Jackson Elementary School, Taft Middle School, and John F. Kennedy High School.
Ownership History
Date
Name
Owned For
Owner Type
Purchase Details
Closed on
Apr 11, 2018
Sold by
Ramlo Randy A and Ramlo Lisa C
Bought by
Ramlo Randy A and Ramlo Lisa C
Current Estimated Value
Purchase Details
Closed on
Jun 11, 2007
Sold by
Faganel Paul R and Faganel Wendy C
Bought by
Ramlo Randy A and Ramlo Lisa C
Home Financials for this Owner
Home Financials are based on the most recent Mortgage that was taken out on this home.
Original Mortgage
$415,000
Outstanding Balance
$267,183
Interest Rate
6.2%
Mortgage Type
Purchase Money Mortgage
Estimated Equity
$529,828
Purchase Details
Closed on
Jun 1, 1999
Sold by
Jim Sattler Construction Co Inc
Bought by
Faganel Paul R and Faganel Wendy C
Home Financials for this Owner
Home Financials are based on the most recent Mortgage that was taken out on this home.
Original Mortgage
$360,000
Interest Rate
6.94%
Purchase Details
Closed on
Apr 16, 1998
Sold by
Dyer Sattler Partnership
Bought by
Jim Sattler Construction Co Inc
Create a Home Valuation Report for This Property
The Home Valuation Report is an in-depth analysis detailing your home's value as well as a comparison with similar homes in the area
Home Values in the Area
Average Home Value in this Area
Purchase History
| Date | Buyer | Sale Price | Title Company |
|---|---|---|---|
| Ramlo Randy A | -- | None Available | |
| Ramlo Randy A | $821,500 | None Available | |
| Faganel Paul R | $757,000 | -- | |
| Jim Sattler Construction Co Inc | -- | -- |
Source: Public Records
Mortgage History
| Date | Status | Borrower | Loan Amount |
|---|---|---|---|
| Open | Ramlo Lisa C | $194,919 | |
| Open | Ramlo Randy A | $415,000 | |
| Closed | Ramlo Lisa C | $200,000 | |
| Previous Owner | Faganel Paul R | $360,000 |
Source: Public Records
Tax History Compared to Growth
Tax History
| Year | Tax Paid | Tax Assessment Tax Assessment Total Assessment is a certain percentage of the fair market value that is determined by local assessors to be the total taxable value of land and additions on the property. | Land | Improvement |
|---|---|---|---|---|
| 2023 | $16,158 | $797,300 | $125,400 | $671,900 |
| 2022 | $13,970 | $780,200 | $120,200 | $660,000 |
| 2021 | $15,180 | $683,300 | $64,000 | $619,300 |
| 2020 | $15,180 | $696,600 | $64,000 | $632,600 |
| 2019 | $14,832 | $696,600 | $64,000 | $632,600 |
| 2018 | $14,418 | $696,600 | $64,000 | $632,600 |
| 2017 | $13,514 | $671,100 | $64,000 | $607,100 |
| 2016 | $13,514 | $635,800 | $64,000 | $571,800 |
| 2015 | $13,738 | $645,650 | $64,000 | $581,650 |
| 2014 | $13,738 | $645,650 | $64,000 | $581,650 |
| 2013 | $13,444 | $645,650 | $64,000 | $581,650 |
Source: Public Records
Map
Nearby Homes
- 3815 Cedar Bluff Ct NE
- 6827 42nd St NE
- 6527 River Oak Ct
- 6711 Summerhill Ct NE
- 3608 Forest Valley Ct NE
- 6430 Ushers Ridge Dr NE
- 6515 Cottage Ridge Ct NE
- 3400 Cedar River Ct NE
- 5225 Seminole Valley Trail
- 5309 Seminole Valley Trail NE
- 7012 Deer Horn Trail NE
- 5402 Seminole Valley Trail NE
- 5407 Seminole Valley Trail NE
- 5434 Seminole Valley Trail NE
- 5425 Seminole Valley Trail NE
- 5431 Seminole Valley Trail NE
- 3900 Willowleaf St NE
- 5801 Seminole Valley Trail NE
- 5521 Seminole Valley Trail NE
- 5515 Seminole Valley Trail NE