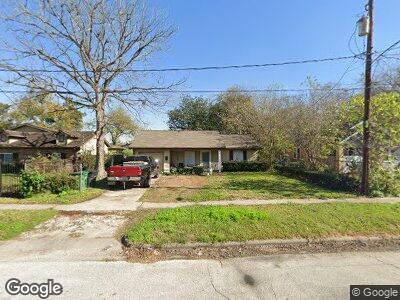
3922 Lavender St Houston, TX 77026
Kashmere Gardens NeighborhoodEstimated Value: $146,590 - $209,000
2
Beds
1
Bath
843
Sq Ft
$202/Sq Ft
Est. Value
About This Home
This home is located at 3922 Lavender St, Houston, TX 77026 and is currently estimated at $170,148, approximately $201 per square foot. 3922 Lavender St is a home located in Harris County with nearby schools including Isaacs Elementary School, Fleming Middle School, and Wheatley High School.
Ownership History
Date
Name
Owned For
Owner Type
Purchase Details
Closed on
Jan 24, 2001
Sold by
Lincoln Illya J
Bought by
Samuel Trula
Current Estimated Value
Purchase Details
Closed on
Jul 21, 1999
Sold by
White James
Bought by
Lincoln Illya J
Home Financials for this Owner
Home Financials are based on the most recent Mortgage that was taken out on this home.
Original Mortgage
$28,000
Interest Rate
7.47%
Mortgage Type
Seller Take Back
Purchase Details
Closed on
Sep 1, 1998
Sold by
Gooden Lawrence Bernard and Fisher Felicia
Bought by
White James
Purchase Details
Closed on
Jan 26, 1998
Sold by
White James
Bought by
Gooden Lawrence Bernard and Fisher Felicia
Home Financials for this Owner
Home Financials are based on the most recent Mortgage that was taken out on this home.
Original Mortgage
$23,500
Interest Rate
6.98%
Mortgage Type
Seller Take Back
Purchase Details
Closed on
Oct 7, 1997
Sold by
Breeler Roscoe and Lewis Emma B
Bought by
White James
Create a Home Valuation Report for This Property
The Home Valuation Report is an in-depth analysis detailing your home's value as well as a comparison with similar homes in the area
Home Values in the Area
Average Home Value in this Area
Purchase History
| Date | Buyer | Sale Price | Title Company |
|---|---|---|---|
| Samuel Trula | -- | -- | |
| Lincoln Illya J | -- | -- | |
| White James | $23,000 | -- | |
| Gooden Lawrence Bernard | -- | -- | |
| White James | $13,900 | -- |
Source: Public Records
Mortgage History
| Date | Status | Borrower | Loan Amount |
|---|---|---|---|
| Previous Owner | Lincoln Illya J | $28,000 | |
| Previous Owner | Gooden Lawrence Bernard | $23,500 | |
| Closed | Samuel Trula | $0 |
Source: Public Records
Tax History Compared to Growth
Tax History
| Year | Tax Paid | Tax Assessment Tax Assessment Total Assessment is a certain percentage of the fair market value that is determined by local assessors to be the total taxable value of land and additions on the property. | Land | Improvement |
|---|---|---|---|---|
| 2023 | $339 | $129,524 | $53,550 | $75,974 |
| 2022 | $1,891 | $100,715 | $38,250 | $62,465 |
| 2021 | $1,820 | $78,079 | $26,775 | $51,304 |
| 2020 | $1,714 | $70,771 | $26,775 | $43,996 |
| 2019 | $1,301 | $51,430 | $15,300 | $36,130 |
| 2018 | $1,301 | $51,430 | $13,770 | $37,660 |
| 2017 | $1,300 | $51,430 | $13,770 | $37,660 |
| 2016 | $1,204 | $47,632 | $10,710 | $36,922 |
| 2015 | $1,051 | $40,866 | $7,650 | $33,216 |
| 2014 | $1,051 | $40,866 | $7,650 | $33,216 |
Source: Public Records
Map
Nearby Homes
- 5101 Crane St
- 4806 Crane St
- 3914 Wipprecht
- 3922 Pickfair St
- 2207 Des Chaumes St
- 2106 Bringhurst St
- 3705 Jensen
- 5106 Cavalcade St
- 5317 Caplin St
- 3429 King St
- 4709 S Cavalcade St
- 4705 S Cavalcade St
- 3435 Sayers St
- 4506 Wayne St
- 4602 Kress St
- 3817 Wipprecht St
- 3821 Wipprecht St
- 4302 Lavender St
- 3601 Crane St
- 3611 Crane St