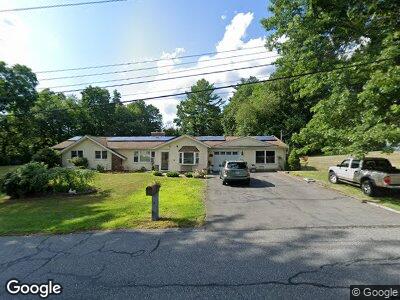
4 Wilbur Dr Ashland, MA 01721
Estimated Value: $556,000 - $625,072
3
Beds
2
Baths
1,452
Sq Ft
$407/Sq Ft
Est. Value
About This Home
This home is located at 4 Wilbur Dr, Ashland, MA 01721 and is currently estimated at $591,518, approximately $407 per square foot. 4 Wilbur Dr is a home located in Middlesex County with nearby schools including William Pittaway Elementary School, David Mindess Elementary School, and Henry E. Warren Elementary School.
Ownership History
Date
Name
Owned For
Owner Type
Purchase Details
Closed on
Oct 31, 2020
Sold by
Allen Michael F and Campone Maria G
Bought by
Allen Michael F and Campone Maria G
Current Estimated Value
Purchase Details
Closed on
Jun 12, 2003
Sold by
Sansossio Maria G
Bought by
Allen Michael F and Campone Maria G
Home Financials for this Owner
Home Financials are based on the most recent Mortgage that was taken out on this home.
Original Mortgage
$110,000
Interest Rate
5.77%
Purchase Details
Closed on
Jun 28, 2002
Sold by
Mccaig Harold J and Mccaig Mary Ellen
Bought by
Sansossio Maria
Home Financials for this Owner
Home Financials are based on the most recent Mortgage that was taken out on this home.
Original Mortgage
$155,000
Interest Rate
6.92%
Mortgage Type
Purchase Money Mortgage
Create a Home Valuation Report for This Property
The Home Valuation Report is an in-depth analysis detailing your home's value as well as a comparison with similar homes in the area
Home Values in the Area
Average Home Value in this Area
Purchase History
| Date | Buyer | Sale Price | Title Company |
|---|---|---|---|
| Allen Michael F | -- | None Available | |
| Allen Michael F | -- | None Available | |
| Allen Michael F | -- | -- | |
| Sansossio Maria | $255,000 | -- |
Source: Public Records
Mortgage History
| Date | Status | Borrower | Loan Amount |
|---|---|---|---|
| Previous Owner | Allen Michael F | $110,000 | |
| Previous Owner | Sansossio Maria | $155,000 | |
| Previous Owner | Mccaig Maryellen M | $112,000 | |
| Previous Owner | Mccaig Maryellen M | $20,000 |
Source: Public Records
Tax History Compared to Growth
Tax History
| Year | Tax Paid | Tax Assessment Tax Assessment Total Assessment is a certain percentage of the fair market value that is determined by local assessors to be the total taxable value of land and additions on the property. | Land | Improvement |
|---|---|---|---|---|
| 2024 | $7,324 | $553,200 | $297,900 | $255,300 |
| 2023 | $6,877 | $499,400 | $284,400 | $215,000 |
| 2022 | $7,100 | $447,100 | $258,100 | $189,000 |
| 2021 | $6,780 | $425,600 | $258,100 | $167,500 |
| 2020 | $6,593 | $408,000 | $258,100 | $149,900 |
| 2019 | $6,395 | $392,800 | $258,100 | $134,700 |
| 2018 | $6,210 | $373,900 | $255,600 | $118,300 |
| 2017 | $6,196 | $371,000 | $255,600 | $115,400 |
| 2016 | $6,135 | $360,900 | $255,600 | $105,300 |
| 2015 | $5,794 | $334,900 | $241,500 | $93,400 |
| 2014 | $5,528 | $317,900 | $225,600 | $92,300 |
Source: Public Records
Map
Nearby Homes
- 54 High St
- 9 Pennock Rd
- 15 Pennock Rd
- 23 Ramblewood Dr
- 0 Cross St
- 3 Johnson St
- 104 W Union St
- 0 Cordaville Rd
- 94 Pleasant St Unit 96
- 171 Cherry St
- 19 Juniper Trail Unit 19
- 54 Sudbury Rd
- 0 Highland Unit 73301743
- 12 Waterville Ln Unit 12
- 14 Waterville Ln Unit 14
- 18 Waterville Ln Unit 18
- 33 Pine Hill Rd
- 5 Sweetwater Way Unit 5
- 274 Union St
- 4 Clubhouse Ln Unit 4