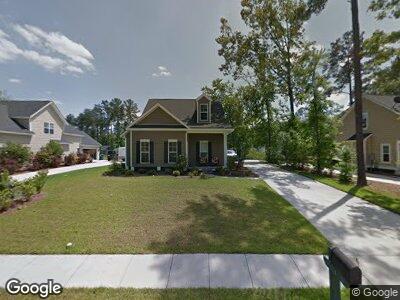
40 Bark Branch Rd Richmond Hill, GA 31324
Estimated Value: $396,000 - $421,000
4
Beds
4
Baths
1,943
Sq Ft
$211/Sq Ft
Est. Value
About This Home
This home is located at 40 Bark Branch Rd, Richmond Hill, GA 31324 and is currently estimated at $409,091, approximately $210 per square foot. 40 Bark Branch Rd is a home located in Bryan County with nearby schools including Richmond Hill Primary School, Dr. George Washington Carver Elementary School, and Richmond Hill Elementary School.
Ownership History
Date
Name
Owned For
Owner Type
Purchase Details
Closed on
Oct 5, 2009
Sold by
Synergy Designer Homes Inc
Bought by
Beard James D and Beard Carol M
Current Estimated Value
Home Financials for this Owner
Home Financials are based on the most recent Mortgage that was taken out on this home.
Original Mortgage
$250,067
Interest Rate
5.05%
Mortgage Type
VA
Purchase Details
Closed on
Aug 7, 2009
Sold by
Olde South Construction Llc
Bought by
Synergy Designer Homes Inc
Home Financials for this Owner
Home Financials are based on the most recent Mortgage that was taken out on this home.
Original Mortgage
$250,067
Interest Rate
5.05%
Mortgage Type
VA
Purchase Details
Closed on
Jul 13, 2007
Bought by
Olde South Construction Llc
Create a Home Valuation Report for This Property
The Home Valuation Report is an in-depth analysis detailing your home's value as well as a comparison with similar homes in the area
Home Values in the Area
Average Home Value in this Area
Purchase History
| Date | Buyer | Sale Price | Title Company |
|---|---|---|---|
| Beard James D | $250,067 | -- | |
| Synergy Designer Homes Inc | $55,000 | -- | |
| Olde South Construction Llc | $55,100 | -- |
Source: Public Records
Mortgage History
| Date | Status | Borrower | Loan Amount |
|---|---|---|---|
| Open | Beard James D | $251,800 | |
| Closed | Beard James D | $263,000 | |
| Closed | Beard James D | $255,500 | |
| Closed | Beard James D | $260,989 | |
| Closed | Beard James D | $250,067 | |
| Previous Owner | Synergy Designer Homes Inc | $156,000 |
Source: Public Records
Tax History Compared to Growth
Tax History
| Year | Tax Paid | Tax Assessment Tax Assessment Total Assessment is a certain percentage of the fair market value that is determined by local assessors to be the total taxable value of land and additions on the property. | Land | Improvement |
|---|---|---|---|---|
| 2024 | $610 | $139,920 | $32,000 | $107,920 |
| 2023 | $610 | $139,440 | $32,000 | $107,440 |
| 2022 | $409 | $116,320 | $32,000 | $84,320 |
| 2021 | $93 | $104,120 | $32,000 | $72,120 |
| 2020 | $2,922 | $100,680 | $32,000 | $68,680 |
| 2019 | $376 | $98,480 | $30,800 | $67,680 |
| 2018 | $513 | $98,480 | $30,800 | $67,680 |
| 2017 | $2,578 | $103,720 | $36,000 | $67,720 |
| 2016 | $2,543 | $101,720 | $36,000 | $65,720 |
| 2015 | $2,528 | $100,320 | $36,000 | $64,320 |
| 2014 | $2,572 | $101,720 | $36,000 | $65,720 |
Source: Public Records
Map
Nearby Homes
- 161 Shortleaf Trail
- 25 Richmond Walk Dr
- 110 Tupelo Trail
- 75 Golden Rod Loop
- 26 Grove Park Dr
- 70 Richmond Walk Dr
- 80 Tupelo Trail
- 45 Lonnie Dr
- 110 Whitaker Way N
- 32 Lennox Ct
- 16 Vining Way
- 90 Cottage Ct
- 370 Kepler Loop
- 180 Kepler Loop
- 140 Cantle Dr
- 25 Smoke Rise Rd
- 300 Cantle Dr
- 175 Live Oak Dr
- 323 Landing Way
- 70 Glen Way