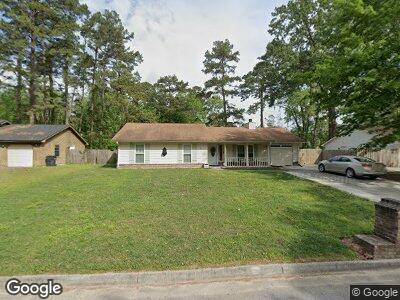
40 Beaver Run Dr Savannah, GA 31419
Estimated Value: $285,000 - $315,000
3
Beds
2
Baths
1,362
Sq Ft
$217/Sq Ft
Est. Value
About This Home
This home is located at 40 Beaver Run Dr, Savannah, GA 31419 and is currently estimated at $296,160, approximately $217 per square foot. 40 Beaver Run Dr is a home located in Chatham County with nearby schools including Windsor Forest High School, Georgetown School, and Eastgate Christian Academy.
Ownership History
Date
Name
Owned For
Owner Type
Purchase Details
Closed on
Feb 15, 2019
Sold by
Ferrell Erica
Bought by
Ferrell Erica and Newton Eric
Current Estimated Value
Home Financials for this Owner
Home Financials are based on the most recent Mortgage that was taken out on this home.
Original Mortgage
$126,500
Outstanding Balance
$112,772
Interest Rate
4.4%
Mortgage Type
New Conventional
Estimated Equity
$189,026
Purchase Details
Closed on
Jan 29, 2010
Sold by
Fannie Mae
Bought by
Ferrell Erica
Home Financials for this Owner
Home Financials are based on the most recent Mortgage that was taken out on this home.
Original Mortgage
$103,785
Interest Rate
5.5%
Mortgage Type
FHA
Purchase Details
Closed on
Sep 2, 2009
Sold by
Bac Home Loans Servicing L
Bought by
Federla National Mtg Associati
Purchase Details
Closed on
Nov 24, 2006
Sold by
Not Provided
Bought by
Ferrell Erica
Create a Home Valuation Report for This Property
The Home Valuation Report is an in-depth analysis detailing your home's value as well as a comparison with similar homes in the area
Home Values in the Area
Average Home Value in this Area
Purchase History
| Date | Buyer | Sale Price | Title Company |
|---|---|---|---|
| Ferrell Erica | -- | -- | |
| Ferrell Erica | $116,000 | -- | |
| Federla National Mtg Associati | -- | -- | |
| Bac Home Loans Servicing Lp | -- | -- | |
| Ferrell Erica | $150,000 | -- |
Source: Public Records
Mortgage History
| Date | Status | Borrower | Loan Amount |
|---|---|---|---|
| Open | Ferrell Erica | $126,500 | |
| Previous Owner | Ferrell Erica | $103,785 | |
| Previous Owner | Ferrell Erica | $14,000 |
Source: Public Records
Tax History Compared to Growth
Tax History
| Year | Tax Paid | Tax Assessment Tax Assessment Total Assessment is a certain percentage of the fair market value that is determined by local assessors to be the total taxable value of land and additions on the property. | Land | Improvement |
|---|---|---|---|---|
| 2024 | $1,023 | $85,120 | $26,000 | $59,120 |
| 2023 | $1,023 | $56,600 | $16,000 | $40,600 |
| 2022 | $1,422 | $52,720 | $16,000 | $36,720 |
| 2021 | $1,519 | $47,240 | $11,200 | $36,040 |
| 2020 | $1,460 | $47,240 | $11,200 | $36,040 |
| 2019 | $1,574 | $47,240 | $11,200 | $36,040 |
| 2018 | $1,552 | $46,160 | $11,200 | $34,960 |
| 2017 | $1,564 | $47,280 | $11,200 | $36,080 |
| 2016 | $1,404 | $47,600 | $11,200 | $36,400 |
| 2015 | $1,323 | $44,520 | $8,000 | $36,520 |
| 2014 | $1,625 | $39,840 | $0 | $0 |
Source: Public Records
Map
Nearby Homes
- 150 Sessile Oak Dr
- 24 Red Fox Dr
- 205 Sessile Oak Dr
- 654 Sessile Oak Dr
- 557 Sessile Oak Dr
- 638 Sessile Oak Dr
- 726 Sessile Oak Dr
- 622 Sessile Oak Dr
- 662 Sessile Oak Dr
- 541 Sessile Oak Dr
- 525 Sessile Oak Dr
- 135 Sessile Oak Dr
- 2 Emmet Ct
- 12 Green Iris Ct
- 582 Sessile Oak Dr
- 606 Sessile Oak Dr
- 598 Sessile Oak Dr
- 566 Sessile Oak Dr
- 158 Lions Gate Rd
- 9 Sweetwater Ct