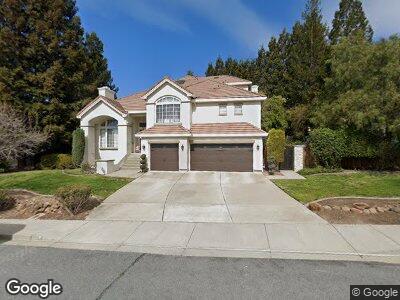
400 Chantecler Dr Fremont, CA 94539
Weibel NeighborhoodEstimated Value: $2,770,000 - $4,126,000
5
Beds
4
Baths
3,329
Sq Ft
$1,076/Sq Ft
Est. Value
About This Home
This home is located at 400 Chantecler Dr, Fremont, CA 94539 and is currently estimated at $3,583,601, approximately $1,076 per square foot. 400 Chantecler Dr is a home located in Alameda County with nearby schools including Mission San Jose Elementary School, William Hopkins Junior High School, and Mission San Jose High School.
Ownership History
Date
Name
Owned For
Owner Type
Purchase Details
Closed on
Apr 10, 2015
Sold by
Weiss Jennifer J and Taber David O
Bought by
Yeh Mark J and Cheng Wan Ling
Current Estimated Value
Home Financials for this Owner
Home Financials are based on the most recent Mortgage that was taken out on this home.
Original Mortgage
$1,400,000
Interest Rate
2.75%
Mortgage Type
Adjustable Rate Mortgage/ARM
Purchase Details
Closed on
Aug 12, 1996
Sold by
Lenser Paul T and Lenser Pauline M
Bought by
Taber David O and Weiss Jennifer J
Home Financials for this Owner
Home Financials are based on the most recent Mortgage that was taken out on this home.
Original Mortgage
$548,000
Interest Rate
7.75%
Create a Home Valuation Report for This Property
The Home Valuation Report is an in-depth analysis detailing your home's value as well as a comparison with similar homes in the area
Home Values in the Area
Average Home Value in this Area
Purchase History
| Date | Buyer | Sale Price | Title Company |
|---|---|---|---|
| Yeh Mark J | $2,170,000 | Chicago Title Company | |
| Taber David O | $685,000 | Chicago Title Co |
Source: Public Records
Mortgage History
| Date | Status | Borrower | Loan Amount |
|---|---|---|---|
| Open | Yeh Marj K | $1,190,000 | |
| Closed | Yeh Mark J | $250,000 | |
| Closed | Yeh Mark J | $285,000 | |
| Closed | Yeh Mark J | $1,400,000 | |
| Previous Owner | Taber David O | $535,000 | |
| Previous Owner | Taber David O | $548,000 |
Source: Public Records
Tax History Compared to Growth
Tax History
| Year | Tax Paid | Tax Assessment Tax Assessment Total Assessment is a certain percentage of the fair market value that is determined by local assessors to be the total taxable value of land and additions on the property. | Land | Improvement |
|---|---|---|---|---|
| 2024 | $29,877 | $2,549,802 | $824,775 | $1,732,027 |
| 2023 | $29,128 | $2,506,675 | $808,605 | $1,698,070 |
| 2022 | $28,821 | $2,450,525 | $792,750 | $1,664,775 |
| 2021 | $28,100 | $2,402,351 | $777,210 | $1,632,141 |
| 2020 | $28,399 | $2,384,656 | $769,244 | $1,615,412 |
| 2019 | $28,066 | $2,337,914 | $754,166 | $1,583,748 |
| 2018 | $27,530 | $2,292,084 | $739,382 | $1,552,702 |
| 2017 | $26,816 | $2,247,143 | $724,885 | $1,522,258 |
| 2016 | $26,398 | $2,203,092 | $710,675 | $1,492,417 |
| 2015 | $11,505 | $928,257 | $278,477 | $649,780 |
| 2014 | $11,313 | $910,077 | $273,023 | $637,054 |
Source: Public Records
Map
Nearby Homes
- 44555 Overlook Terrace
- 430 Hunter Ln
- 44673 Japala Place
- 146 Paso Olmo Terrace
- 129 Doe Ct
- 43674 Ellsworth St Unit 2
- 314 Lemarc St
- 43457 Jerome Ave
- 43393 Mission Blvd
- 45596 Cherokee Ln
- 56 Cayuga Place
- 43412 Olivos Ct
- 43370 Banda Terrace
- 1833 Nakoma Ct
- 43354 Banda Terrace
- 43065 Calle Esperanza
- 43073 Calle Esperanza
- 43148 Calle Sagrada
- 568 Emerson St
- 1748 Kilowatt Way Unit 302