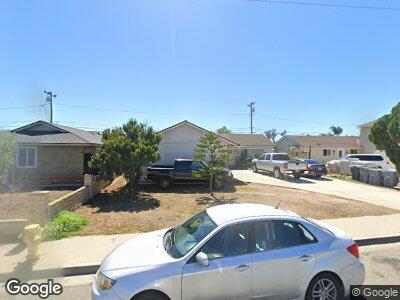
400 La Canada Ave Oxnard, CA 93033
Blackstock North NeighborhoodEstimated Value: $606,000 - $668,674
4
Beds
2
Baths
1,199
Sq Ft
$533/Sq Ft
Est. Value
About This Home
This home is located at 400 La Canada Ave, Oxnard, CA 93033 and is currently estimated at $638,919, approximately $532 per square foot. 400 La Canada Ave is a home located in Ventura County with nearby schools including Ansgar Larsen Elementary School, Hueneme High School, and St. Anthony's Elementary School.
Ownership History
Date
Name
Owned For
Owner Type
Purchase Details
Closed on
Feb 23, 2024
Sold by
Naranjo Marciano and Naranjo Maria T
Bought by
Marciano & Maria Naranjo 2024 Trust and Naranjo
Current Estimated Value
Purchase Details
Closed on
Aug 25, 2022
Sold by
Jorge Escobar
Bought by
Jorge & Maria Escobar 2022 Trust
Purchase Details
Closed on
Jul 5, 2005
Sold by
Naranjo Marciano and Naranjo Maria T
Bought by
Naranjo Marciano and Naranjo Maria T
Purchase Details
Closed on
Aug 11, 2003
Sold by
Naranjo Marciano and Naranjo Maria T
Bought by
Naranjo Marciano and Naranjo Maria T
Home Financials for this Owner
Home Financials are based on the most recent Mortgage that was taken out on this home.
Original Mortgage
$243,750
Interest Rate
5%
Mortgage Type
Purchase Money Mortgage
Create a Home Valuation Report for This Property
The Home Valuation Report is an in-depth analysis detailing your home's value as well as a comparison with similar homes in the area
Home Values in the Area
Average Home Value in this Area
Purchase History
| Date | Buyer | Sale Price | Title Company |
|---|---|---|---|
| Marciano & Maria Naranjo 2024 Trust | -- | None Listed On Document | |
| Jorge & Maria Escobar 2022 Trust | -- | None Listed On Document | |
| Naranjo Marciano | -- | -- | |
| Naranjo Marciano | $122,000 | Old Republic Title Company |
Source: Public Records
Mortgage History
| Date | Status | Borrower | Loan Amount |
|---|---|---|---|
| Previous Owner | Naranjo Marciano | $250,000 | |
| Previous Owner | Naranjo Marciano | $246,500 | |
| Previous Owner | Naranjo Marciano | $243,750 |
Source: Public Records
Tax History Compared to Growth
Tax History
| Year | Tax Paid | Tax Assessment Tax Assessment Total Assessment is a certain percentage of the fair market value that is determined by local assessors to be the total taxable value of land and additions on the property. | Land | Improvement |
|---|---|---|---|---|
| 2024 | $3,895 | $318,238 | $111,376 | $206,862 |
| 2023 | $3,667 | $311,999 | $109,193 | $202,806 |
| 2022 | $3,591 | $305,882 | $107,052 | $198,830 |
| 2021 | $3,636 | $299,885 | $104,953 | $194,932 |
| 2020 | $3,702 | $296,812 | $103,878 | $192,934 |
| 2019 | $3,592 | $290,993 | $101,842 | $189,151 |
| 2018 | $3,460 | $285,289 | $99,846 | $185,443 |
| 2017 | $3,348 | $279,696 | $97,889 | $181,807 |
| 2016 | $3,189 | $274,213 | $95,970 | $178,243 |
| 2015 | $3,238 | $270,096 | $94,530 | $175,566 |
| 2014 | $3,180 | $264,807 | $92,679 | $172,128 |
Source: Public Records
Map
Nearby Homes
- 430 La Canada Ave
- 311 De Anza Way
- 0 Saviers Rd
- 3611 Saviers Rd
- 265 Gaviota Place Unit SP147
- 440 Lowell Place Unit 102
- 140 Borrego Ave Unit 174
- 4105 Bradfield Dr Unit 55
- 237 Lark St
- 166 Johnson Rd
- 150 Johnson Rd
- 411 Percy St Unit 25
- 564 Nectarine St
- 4526 Saviers Rd
- 3640 S J St
- 510 E Dollie St
- 721 Helena Ct
- 504 E Juniper St
- 252 Ashton St
- 421 Andrea Dr