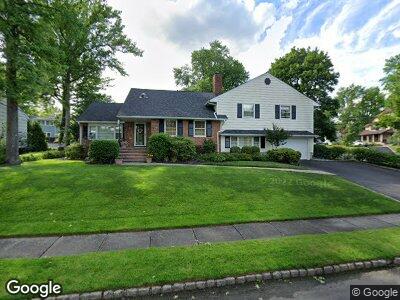
400 Poe Ave Westfield, NJ 07090
Estimated Value: $1,209,371 - $1,431,000
--
Bed
--
Bath
3,615
Sq Ft
$369/Sq Ft
Est. Value
About This Home
This home is located at 400 Poe Ave, Westfield, NJ 07090 and is currently estimated at $1,334,093, approximately $369 per square foot. 400 Poe Ave is a home located in Union County with nearby schools including Jefferson Elementary School, Edison Intermediate School, and Westfield Senior High School.
Ownership History
Date
Name
Owned For
Owner Type
Purchase Details
Closed on
Dec 15, 2004
Sold by
Levine Samuel
Bought by
Brown Laura
Current Estimated Value
Home Financials for this Owner
Home Financials are based on the most recent Mortgage that was taken out on this home.
Original Mortgage
$567,000
Interest Rate
5.74%
Purchase Details
Closed on
Jan 27, 1998
Sold by
Levine Samuel and Levine Millicent K
Bought by
Levine Millicent K
Create a Home Valuation Report for This Property
The Home Valuation Report is an in-depth analysis detailing your home's value as well as a comparison with similar homes in the area
Home Values in the Area
Average Home Value in this Area
Purchase History
| Date | Buyer | Sale Price | Title Company |
|---|---|---|---|
| Brown Laura | $737,000 | -- | |
| Levine Millicent K | -- | -- |
Source: Public Records
Mortgage History
| Date | Status | Borrower | Loan Amount |
|---|---|---|---|
| Open | Brown Laura | $397,000 | |
| Closed | Brown Laura | $90,000 | |
| Closed | Brown Laura | $567,000 |
Source: Public Records
Tax History Compared to Growth
Tax History
| Year | Tax Paid | Tax Assessment Tax Assessment Total Assessment is a certain percentage of the fair market value that is determined by local assessors to be the total taxable value of land and additions on the property. | Land | Improvement |
|---|---|---|---|---|
| 2024 | $17,385 | $788,100 | $440,900 | $347,200 |
| 2023 | $17,385 | $788,100 | $440,900 | $347,200 |
| 2022 | $17,023 | $788,100 | $440,900 | $347,200 |
| 2021 | $17,047 | $788,100 | $440,900 | $347,200 |
| 2020 | $17,007 | $788,100 | $440,900 | $347,200 |
| 2019 | $16,944 | $788,100 | $440,900 | $347,200 |
| 2018 | $18,166 | $195,400 | $74,000 | $121,400 |
| 2017 | $18,067 | $195,400 | $74,000 | $121,400 |
| 2016 | $17,643 | $195,400 | $74,000 | $121,400 |
| 2015 | $17,291 | $195,400 | $74,000 | $121,400 |
| 2014 | $19,527 | $228,200 | $74,000 | $154,200 |
Source: Public Records
Map
Nearby Homes