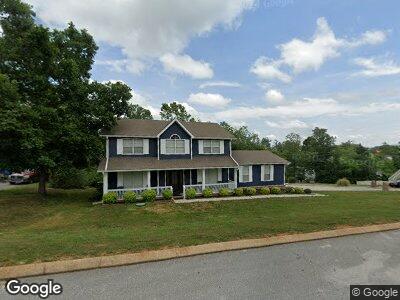
4001 Deermont Ct Chattanooga, TN 37421
Collegedale NeighborhoodEstimated Value: $388,990 - $458,000
4
Beds
3
Baths
2,379
Sq Ft
$178/Sq Ft
Est. Value
About This Home
This home is located at 4001 Deermont Ct, Chattanooga, TN 37421 and is currently estimated at $423,748, approximately $178 per square foot. 4001 Deermont Ct is a home located in Hamilton County with nearby schools including Wolftever Creek Elementary School, Ooltewah Middle School, and Ooltewah High School.
Ownership History
Date
Name
Owned For
Owner Type
Purchase Details
Closed on
Jun 25, 2004
Sold by
Circco Carolyn Lee
Bought by
Dallava Frederick P and Dallava Robin Beth
Current Estimated Value
Home Financials for this Owner
Home Financials are based on the most recent Mortgage that was taken out on this home.
Original Mortgage
$132,000
Interest Rate
6.25%
Mortgage Type
Unknown
Purchase Details
Closed on
Apr 26, 2001
Sold by
Palmer Brenda G
Bought by
Circeo Carolyn Lee
Home Financials for this Owner
Home Financials are based on the most recent Mortgage that was taken out on this home.
Original Mortgage
$124,000
Interest Rate
6.9%
Purchase Details
Closed on
Aug 21, 1998
Sold by
Gibson Shane E and Gibson Debra D
Bought by
Palmer Brenda G
Home Financials for this Owner
Home Financials are based on the most recent Mortgage that was taken out on this home.
Original Mortgage
$80,000
Interest Rate
6.92%
Create a Home Valuation Report for This Property
The Home Valuation Report is an in-depth analysis detailing your home's value as well as a comparison with similar homes in the area
Home Values in the Area
Average Home Value in this Area
Purchase History
| Date | Buyer | Sale Price | Title Company |
|---|---|---|---|
| Dallava Frederick P | $165,000 | Legal Title & Escrow Inc | |
| Circeo Carolyn Lee | $140,500 | Legal Title & Escrow Inc | |
| Palmer Brenda G | $131,500 | -- |
Source: Public Records
Mortgage History
| Date | Status | Borrower | Loan Amount |
|---|---|---|---|
| Open | Dallava Robin B | $110,000 | |
| Closed | Dallava Frederick P | $132,000 | |
| Previous Owner | Circeo Carolyn Lee | $124,000 | |
| Previous Owner | Palmer Brenda G | $80,000 | |
| Closed | Dallava Frederick P | $15,000 |
Source: Public Records
Tax History Compared to Growth
Tax History
| Year | Tax Paid | Tax Assessment Tax Assessment Total Assessment is a certain percentage of the fair market value that is determined by local assessors to be the total taxable value of land and additions on the property. | Land | Improvement |
|---|---|---|---|---|
| 2024 | $1,421 | $63,500 | $0 | $0 |
| 2023 | $1,430 | $63,500 | $0 | $0 |
| 2022 | $1,430 | $63,500 | $0 | $0 |
| 2021 | $1,430 | $63,500 | $0 | $0 |
| 2020 | $1,492 | $53,625 | $0 | $0 |
| 2019 | $1,492 | $53,625 | $0 | $0 |
| 2018 | $1,492 | $53,625 | $0 | $0 |
| 2017 | $1,492 | $53,625 | $0 | $0 |
| 2016 | $1,367 | $0 | $0 | $0 |
| 2015 | $1,367 | $49,125 | $0 | $0 |
| 2014 | $1,367 | $0 | $0 | $0 |
Source: Public Records
Map
Nearby Homes
- 3900 Brock Rd
- 7910 Chianti Way
- 7954 Burgundy Cir
- 4112 Lost Oaks Dr
- 8016 Standifer Gap Rd
- 2892 Old Britain Cir
- 8115 Standifer Gap Rd
- 4214 Green Shanty Rd
- 4307 Green Shanty Rd
- 2607 Reid Dr
- 2515 Sharron Dr
- 2345 Jennifer Dr
- 7738 Pinewood Dr
- 4012 Pattentown Rd
- 4210 Pattentown Rd
- 4746 Buckingham Dr
- 4742 Buckingham Dr
- 2813 Nile Rd
- 2421 Corral Trail
- 7845 Legacy Park Ct