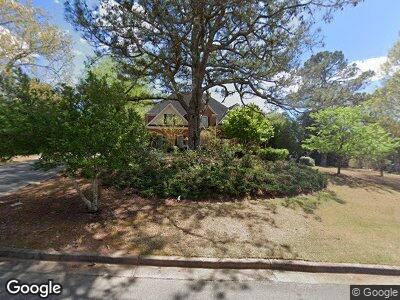
401 Calton Hill Ct Alpharetta, GA 30004
Estimated Value: $873,000 - $1,153,000
4
Beds
4
Baths
3,735
Sq Ft
$281/Sq Ft
Est. Value
About This Home
This home is located at 401 Calton Hill Ct, Alpharetta, GA 30004 and is currently estimated at $1,048,028, approximately $280 per square foot. 401 Calton Hill Ct is a home located in Fulton County with nearby schools including Summit Hill Elementary School, Hopewell Middle School, and Cambridge High School.
Ownership History
Date
Name
Owned For
Owner Type
Purchase Details
Closed on
Dec 20, 2006
Sold by
Vance David and Vance Antoinette
Bought by
Sherman William H and Sherman Valerie J
Current Estimated Value
Home Financials for this Owner
Home Financials are based on the most recent Mortgage that was taken out on this home.
Original Mortgage
$392,000
Interest Rate
6.19%
Mortgage Type
New Conventional
Purchase Details
Closed on
Jun 13, 2006
Sold by
Vance Antoinette
Bought by
Vance David and Vance Antoinette
Home Financials for this Owner
Home Financials are based on the most recent Mortgage that was taken out on this home.
Original Mortgage
$120,000
Interest Rate
6.57%
Mortgage Type
New Conventional
Purchase Details
Closed on
Sep 10, 1999
Sold by
Vance David T and Vance Antionette
Bought by
Vance Antoinetee
Purchase Details
Closed on
Dec 12, 1997
Sold by
Potterstone Bldrs Inc
Bought by
Vance David T and Vance Antoinette
Home Financials for this Owner
Home Financials are based on the most recent Mortgage that was taken out on this home.
Original Mortgage
$260,000
Interest Rate
7.26%
Mortgage Type
New Conventional
Create a Home Valuation Report for This Property
The Home Valuation Report is an in-depth analysis detailing your home's value as well as a comparison with similar homes in the area
Home Values in the Area
Average Home Value in this Area
Purchase History
| Date | Buyer | Sale Price | Title Company |
|---|---|---|---|
| Sherman William H | $490,000 | -- | |
| Vance David | -- | -- | |
| Vance Antoinetee | -- | -- | |
| Vance David T | $335,000 | -- |
Source: Public Records
Mortgage History
| Date | Status | Borrower | Loan Amount |
|---|---|---|---|
| Open | Sherman William H | $354,750 | |
| Closed | Sherman William H | $50,000 | |
| Closed | Sherman William H | $392,000 | |
| Previous Owner | Vance David | $120,000 | |
| Previous Owner | Vance David T | $300,000 | |
| Previous Owner | Vance David T | $260,000 |
Source: Public Records
Tax History Compared to Growth
Tax History
| Year | Tax Paid | Tax Assessment Tax Assessment Total Assessment is a certain percentage of the fair market value that is determined by local assessors to be the total taxable value of land and additions on the property. | Land | Improvement |
|---|---|---|---|---|
| 2023 | $7,053 | $249,880 | $52,080 | $197,800 |
| 2022 | $5,054 | $249,880 | $52,080 | $197,800 |
| 2021 | $5,051 | $232,440 | $49,040 | $183,400 |
| 2020 | $5,109 | $221,160 | $44,840 | $176,320 |
| 2019 | $928 | $257,120 | $41,280 | $215,840 |
| 2018 | $6,330 | $251,080 | $40,320 | $210,760 |
| 2017 | $5,169 | $189,120 | $37,720 | $151,400 |
| 2016 | $4,669 | $172,000 | $37,720 | $134,280 |
| 2015 | $5,431 | $172,000 | $37,720 | $134,280 |
| 2014 | $4,882 | $172,000 | $37,720 | $134,280 |
Source: Public Records
Map
Nearby Homes
- 451 Calton Hill Ct
- 14805 E Bluff Rd
- 14935 E Bluff Rd
- 14840 E Bluff Rd
- 14870 E Bluff Rd
- 0 NE Clan St Unit 7505718
- 0 State Highway 9 Hwy Unit 10257856
- 14200 Hopewell Rd
- 5219 Union Hill
- 5211 Union Hill
- 240 Thompson Trail
- 15200 Fairfax Ln
- 14565 Hopewell Rd
- 14801 Hopewell Rd
- 210 Thompson Trail
- 1530 Redd Rd
- 15245 Fairfax Ln
- 1996 Long Hollow Ln
- 635 Claxton Ln
- 605 Claxton Ln