Estimated Value: $152,000 - $234,000
3
Beds
--
Bath
1,547
Sq Ft
$124/Sq Ft
Est. Value
About This Home
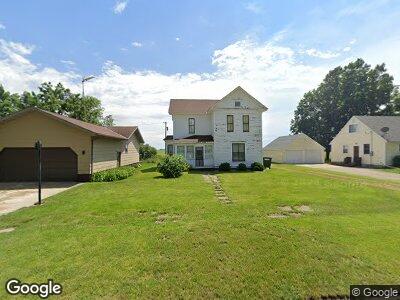
This home is located at 401 South St W, Amboy, MN 56010 and is currently estimated at $191,667, approximately $123 per square foot. 401 South St W is a home with nearby schools including Maple River Secondary School.
Ownership History
Date
Name
Owned For
Owner Type
Purchase Details
Closed on
Apr 12, 2010
Sold by
Graf Robert T and Graf Mary C
Bought by
Graf Jerrold R
Current Estimated Value
Create a Home Valuation Report for This Property
The Home Valuation Report is an in-depth analysis detailing your home's value as well as a comparison with similar homes in the area
Home Values in the Area
Average Home Value in this Area
Purchase History
| Date | Buyer | Sale Price | Title Company |
|---|---|---|---|
| Graf Jerrold R | $3,000 | -- |
Source: Public Records
Tax History Compared to Growth
Tax History
| Year | Tax Paid | Tax Assessment Tax Assessment Total Assessment is a certain percentage of the fair market value that is determined by local assessors to be the total taxable value of land and additions on the property. | Land | Improvement |
|---|---|---|---|---|
| 2024 | $566 | $33,500 | $9,800 | $23,700 |
| 2023 | $578 | $32,500 | $9,800 | $22,700 |
| 2022 | $550 | $27,600 | $9,800 | $17,800 |
| 2021 | $494 | $22,900 | $9,800 | $13,100 |
| 2020 | $424 | $20,400 | $9,800 | $10,600 |
| 2019 | $432 | $20,400 | $9,800 | $10,600 |
| 2018 | $388 | $19,900 | $9,800 | $10,100 |
| 2017 | $378 | $17,400 | $8,100 | $9,300 |
| 2016 | $386 | $17,500 | $8,100 | $9,400 |
| 2015 | $4 | $16,800 | $8,100 | $8,700 |
| 2014 | $316 | $52,500 | $24,300 | $28,200 |
Source: Public Records
Map
Nearby Homes
- 308 308 W Maine St
- 52742 134th St
- 107 Oak St S
- 107 107 S Oak St
- 305 E Main St
- 303 303 E Main St
- 100 100 E 1st St
- 31828 250th St
- 214 5th Ave SE
- 214 Ave
- 54 54 Se 6th Ave
- TBD Tbd 240th St Unit TBD 445th Street
- 37790 180th St
- 507 507 3rd Ave SW
- 507 3rd Ave SW
- 16280 552nd Ave
- 16225 563rd Ave
- 207 Lincoln St SW
- 509 1st Ave SE
- 407 407 Se 1st Ave Unit 407 SE First Avenue