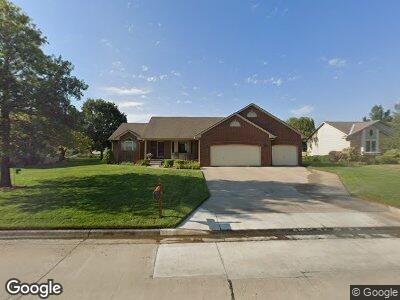
401 Witmarsum West Dr North Newton, KS 67117
Estimated Value: $345,000 - $365,000
4
Beds
3
Baths
1,783
Sq Ft
$199/Sq Ft
Est. Value
About This Home
This home is located at 401 Witmarsum West Dr, North Newton, KS 67117 and is currently estimated at $354,827, approximately $199 per square foot. 401 Witmarsum West Dr is a home located in Harvey County with nearby schools including Northridge Elementary School, Santa Fe Fifth & Sixth Grade Center, and Chisholm Middle School.
Create a Home Valuation Report for This Property
The Home Valuation Report is an in-depth analysis detailing your home's value as well as a comparison with similar homes in the area
Home Values in the Area
Average Home Value in this Area
Tax History Compared to Growth
Tax History
| Year | Tax Paid | Tax Assessment Tax Assessment Total Assessment is a certain percentage of the fair market value that is determined by local assessors to be the total taxable value of land and additions on the property. | Land | Improvement |
|---|---|---|---|---|
| 2024 | $5,946 | $38,283 | $4,211 | $34,072 |
| 2023 | $5,436 | $34,116 | $4,211 | $29,905 |
| 2022 | $5,146 | $32,154 | $4,211 | $27,943 |
| 2021 | $4,904 | $30,597 | $2,075 | $28,522 |
| 2020 | $4,443 | $28,865 | $2,075 | $26,790 |
| 2019 | $4,562 | $29,636 | $2,075 | $27,561 |
| 2018 | $5,457 | $29,044 | $2,075 | $26,969 |
| 2017 | $5,304 | $28,474 | $2,075 | $26,399 |
| 2016 | $5,187 | $27,461 | $2,075 | $25,386 |
| 2015 | $4,802 | $25,910 | $2,075 | $23,835 |
| 2014 | $4,573 | $25,910 | $2,398 | $23,512 |
Source: Public Records
Map
Nearby Homes
- 328 Old Colony Ct
- 329 Old Colony Ct
- 325 Old Colony Ct
- 503 W 23rd St
- 501 W 23rd St
- 210 E 23rd St
- 2032 Briarwood Ct
- 725 Normandy Rd
- 1809 N Main St
- 740 W 17th Street Ct
- 1508 Terrace Dr
- 1016 Country Ln
- 1001 W 17th St
- 1005 W 17th St
- 1009 W 17th St
- 1013 W 17th St
- 1512 Westborough Dr
- 1111 N Main St
- 612 W 10th St
- 1115 N Pine St