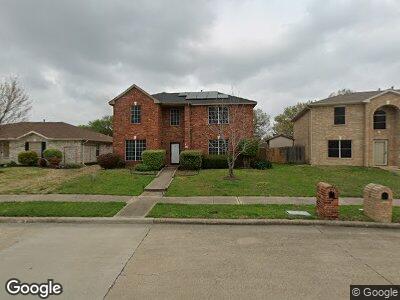
4010 Evinrude Dr Rowlett, TX 75088
Dalrock NeighborhoodEstimated Value: $400,000 - $430,000
4
Beds
3
Baths
3,023
Sq Ft
$137/Sq Ft
Est. Value
About This Home
This home is located at 4010 Evinrude Dr, Rowlett, TX 75088 and is currently estimated at $415,149, approximately $137 per square foot. 4010 Evinrude Dr is a home located in Dallas County with nearby schools including Education Center International Academy Rowlett, Wesleyan Christian Academy, and Providence Academy.
Ownership History
Date
Name
Owned For
Owner Type
Purchase Details
Closed on
May 16, 2011
Sold by
Washington Kimberley
Bought by
Pipkin Rodney
Current Estimated Value
Purchase Details
Closed on
Jun 21, 2007
Sold by
Pettry Stacy Lynn and Pettry Stacy L
Bought by
Pipkin Rodney and Washington Kimberley
Home Financials for this Owner
Home Financials are based on the most recent Mortgage that was taken out on this home.
Original Mortgage
$161,524
Interest Rate
6.19%
Mortgage Type
Purchase Money Mortgage
Purchase Details
Closed on
Aug 21, 2000
Sold by
Beers Kathryn Ann
Bought by
Pettry Stacy Lynn
Purchase Details
Closed on
May 21, 1999
Sold by
Calsouth Corp
Bought by
Beers Kathryn Ann and Petiry Stacy Lynn
Home Financials for this Owner
Home Financials are based on the most recent Mortgage that was taken out on this home.
Original Mortgage
$137,884
Interest Rate
6.94%
Mortgage Type
FHA
Create a Home Valuation Report for This Property
The Home Valuation Report is an in-depth analysis detailing your home's value as well as a comparison with similar homes in the area
Home Values in the Area
Average Home Value in this Area
Purchase History
| Date | Buyer | Sale Price | Title Company |
|---|---|---|---|
| Pipkin Rodney | -- | None Available | |
| Pipkin Rodney | -- | Atc | |
| Pettry Stacy Lynn | -- | -- | |
| Beers Kathryn Ann | -- | -- |
Source: Public Records
Mortgage History
| Date | Status | Borrower | Loan Amount |
|---|---|---|---|
| Open | Pipkin Rodney | $300,000 | |
| Previous Owner | Pipkin Rodney | $161,524 | |
| Previous Owner | Beers Kathryn Ann | $137,884 | |
| Closed | Pettry Stacy Lynn | $0 |
Source: Public Records
Tax History Compared to Growth
Tax History
| Year | Tax Paid | Tax Assessment Tax Assessment Total Assessment is a certain percentage of the fair market value that is determined by local assessors to be the total taxable value of land and additions on the property. | Land | Improvement |
|---|---|---|---|---|
| 2023 | $6,708 | $338,290 | $80,000 | $258,290 |
| 2022 | $8,197 | $338,290 | $80,000 | $258,290 |
| 2021 | $6,825 | $260,720 | $50,000 | $210,720 |
| 2020 | $6,886 | $260,720 | $50,000 | $210,720 |
| 2019 | $7,492 | $260,720 | $50,000 | $210,720 |
| 2018 | $7,545 | $260,720 | $50,000 | $210,720 |
| 2017 | $5,645 | $194,530 | $40,000 | $154,530 |
| 2016 | $5,349 | $184,340 | $30,000 | $154,340 |
| 2015 | $3,387 | $158,030 | $22,000 | $136,030 |
| 2014 | $3,387 | $140,560 | $22,000 | $118,560 |
Source: Public Records
Map
Nearby Homes
- 4109 Martha Ln
- 4110 Starboard Trail
- 7610 Coral Way
- 4118 Tradewind Dr
- 7706 Cousteau Dr
- 7601 Tidewater Dr
- 3801 Martha Ln
- 3907 Lochwood Dr
- 3811 Lochwood Dr
- 3807 Lochwood Dr
- 3723 Lochwood Dr
- 3809 Bermuda Dr
- 7603 Cousteau Dr
- 3812 Lockwood Dr
- 3901 Windmere Dr
- 8301 Watersway Dr
- 7502 Atlantic Dr
- 4506 Horizon Dr
- 7318 Delta Dr
- 7901 Coastway Dr