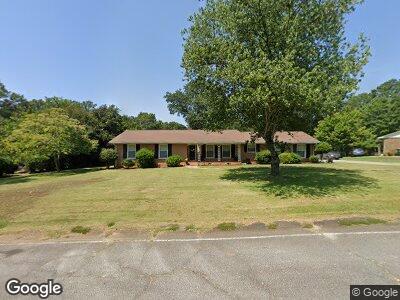
403 Allenby Rd Anderson, SC 29621
Estimated Value: $309,000 - $334,000
3
Beds
2
Baths
2,516
Sq Ft
$127/Sq Ft
Est. Value
About This Home
This home is located at 403 Allenby Rd, Anderson, SC 29621 and is currently estimated at $319,696, approximately $127 per square foot. 403 Allenby Rd is a home located in Anderson County with nearby schools including Calhoun Academy of the Arts, McCants Middle School, and T.L. Hanna High School.
Ownership History
Date
Name
Owned For
Owner Type
Purchase Details
Closed on
Feb 16, 2021
Sold by
Jones Karen Joyce Hampton and Fretwell Peggy Lynn
Bought by
Bateman Christopher B and Bateman Chanda B
Current Estimated Value
Home Financials for this Owner
Home Financials are based on the most recent Mortgage that was taken out on this home.
Original Mortgage
$220,924
Outstanding Balance
$200,126
Interest Rate
2.65%
Mortgage Type
FHA
Estimated Equity
$119,570
Purchase Details
Closed on
Dec 30, 2020
Sold by
Jones Karen Joyce Hampton and Estate Of Peggy Joyce Hampton
Bought by
Hampton Frank C and Hampton Peggy Joyce
Home Financials for this Owner
Home Financials are based on the most recent Mortgage that was taken out on this home.
Original Mortgage
$220,924
Outstanding Balance
$200,126
Interest Rate
2.65%
Mortgage Type
FHA
Estimated Equity
$119,570
Purchase Details
Closed on
Feb 1, 2010
Sold by
Estate Of Frank C Hampton and Hampton Peggy Joyce O
Bought by
Hampton Peggy Joyce Cromer
Create a Home Valuation Report for This Property
The Home Valuation Report is an in-depth analysis detailing your home's value as well as a comparison with similar homes in the area
Home Values in the Area
Average Home Value in this Area
Purchase History
| Date | Buyer | Sale Price | Title Company |
|---|---|---|---|
| Bateman Christopher B | $225,000 | None Available | |
| Hampton Frank C | -- | None Available | |
| Hampton Peggy Joyce Cromer | -- | -- |
Source: Public Records
Mortgage History
| Date | Status | Borrower | Loan Amount |
|---|---|---|---|
| Open | Bateman Chanda B | $4,464 | |
| Open | Bateman Chanda B | $19,319 | |
| Open | Bateman Christopher B | $220,924 |
Source: Public Records
Tax History Compared to Growth
Tax History
| Year | Tax Paid | Tax Assessment Tax Assessment Total Assessment is a certain percentage of the fair market value that is determined by local assessors to be the total taxable value of land and additions on the property. | Land | Improvement |
|---|---|---|---|---|
| 2024 | $1,981 | $8,960 | $1,060 | $7,900 |
| 2023 | $1,981 | $8,960 | $1,060 | $7,900 |
| 2022 | $1,960 | $8,960 | $1,060 | $7,900 |
| 2021 | $1,836 | $8,010 | $800 | $7,210 |
| 2020 | $1,146 | $8,010 | $800 | $7,210 |
| 2019 | $1,146 | $8,010 | $800 | $7,210 |
| 2018 | $1,156 | $8,010 | $800 | $7,210 |
| 2017 | -- | $8,010 | $800 | $7,210 |
| 2016 | $968 | $7,310 | $800 | $6,510 |
| 2015 | $981 | $7,310 | $800 | $6,510 |
| 2014 | $981 | $7,310 | $800 | $6,510 |
Source: Public Records
Map
Nearby Homes
- 503 Allenby Rd
- 1429 E Calhoun St
- 1112 Greenacres
- 1003 Willow Run
- 124 Woodbridge Ct
- 1506 Cornelia Rd
- 804 Wilson St
- 1611 E Calhoun St
- 23 Gilmer Dr
- 2827 Leconte Rd
- 906 E Greenville St
- 31 Chalet Ct
- 109 James Lawrence Orr Dr
- 19 Chalet Ct
- 113 James Lawrence Orr Dr
- 126 Nicklaus Dr
- 110 Nicklaus Dr
- 219 Lehman Way
- 703 E Calhoun St
- 205 Lyttleton Way