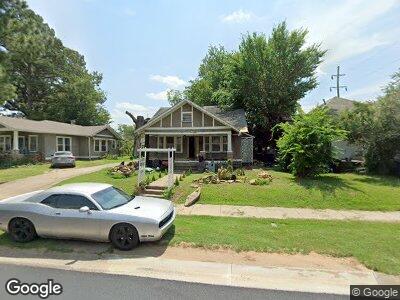
404 N 21st St Fort Smith, AR 72901
Estimated Value: $73,000 - $108,317
--
Bed
1
Bath
1,391
Sq Ft
$61/Sq Ft
Est. Value
About This Home
This home is located at 404 N 21st St, Fort Smith, AR 72901 and is currently estimated at $85,439, approximately $61 per square foot. 404 N 21st St is a home located in Sebastian County with nearby schools including Ballman Elementary School, William O. Darby Junior High School, and Northside High School.
Ownership History
Date
Name
Owned For
Owner Type
Purchase Details
Closed on
Nov 13, 2023
Sold by
Wunsch Izabella
Bought by
Next Level Properties Llc
Current Estimated Value
Home Financials for this Owner
Home Financials are based on the most recent Mortgage that was taken out on this home.
Original Mortgage
$135,075
Outstanding Balance
$134,044
Interest Rate
7.5%
Mortgage Type
New Conventional
Estimated Equity
-$65,543
Purchase Details
Closed on
May 16, 2023
Sold by
Thompson Eric L and Thompson Miriam R
Bought by
Munsell Izabella
Purchase Details
Closed on
Jul 21, 2010
Sold by
Walker Shalian
Bought by
Thompson Eric L and Thompson Miriam R
Purchase Details
Closed on
Jul 20, 2006
Sold by
Destefanos Damara Lucinda and Whelchel Damara Lucinda
Bought by
Awbrey Kenneth W
Purchase Details
Closed on
Jun 8, 2006
Sold by
Jones Iris Breed
Bought by
Whelchel Damara Lucinda
Create a Home Valuation Report for This Property
The Home Valuation Report is an in-depth analysis detailing your home's value as well as a comparison with similar homes in the area
Home Values in the Area
Average Home Value in this Area
Purchase History
| Date | Buyer | Sale Price | Title Company |
|---|---|---|---|
| Next Level Properties Llc | $44,000 | None Listed On Document | |
| Munsell Izabella | -- | None Listed On Document | |
| Thompson Eric L | $23,000 | None Available | |
| Awbrey Kenneth W | $32,000 | None Available | |
| Whelchel Damara Lucinda | -- | None Available |
Source: Public Records
Mortgage History
| Date | Status | Borrower | Loan Amount |
|---|---|---|---|
| Closed | Next Level Properties Llc | $135,075 | |
| Closed | Next Level Properties Llc | $49,000 |
Source: Public Records
Tax History Compared to Growth
Tax History
| Year | Tax Paid | Tax Assessment Tax Assessment Total Assessment is a certain percentage of the fair market value that is determined by local assessors to be the total taxable value of land and additions on the property. | Land | Improvement |
|---|---|---|---|---|
| 2024 | $476 | $9,060 | $2,200 | $6,860 |
| 2023 | $526 | $9,060 | $2,200 | $6,860 |
| 2022 | $526 | $9,060 | $2,200 | $6,860 |
| 2021 | $526 | $9,060 | $2,200 | $6,860 |
| 2020 | $526 | $9,060 | $2,200 | $6,860 |
| 2019 | $525 | $9,040 | $2,200 | $6,840 |
| 2018 | $525 | $9,040 | $2,200 | $6,840 |
| 2017 | $475 | $9,040 | $2,200 | $6,840 |
| 2016 | $431 | $9,040 | $2,200 | $6,840 |
| 2015 | $431 | $9,040 | $2,200 | $6,840 |
| 2014 | $390 | $7,420 | $1,800 | $5,620 |
Source: Public Records