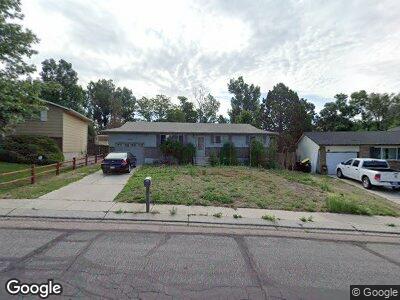
4045 Sod House Trail Colorado Springs, CO 80917
Village Seven NeighborhoodEstimated Value: $373,013 - $476,000
5
Beds
1
Bath
1,097
Sq Ft
$377/Sq Ft
Est. Value
About This Home
This home is located at 4045 Sod House Trail, Colorado Springs, CO 80917 and is currently estimated at $414,003, approximately $377 per square foot. 4045 Sod House Trail is a home located in El Paso County with nearby schools including Rudy Elementary School, Sabin Middle School, and Doherty High School.
Ownership History
Date
Name
Owned For
Owner Type
Purchase Details
Closed on
Sep 22, 2021
Sold by
Rapjack Shauna
Bought by
Bonner Eric L and Bonner Catherine J
Current Estimated Value
Home Financials for this Owner
Home Financials are based on the most recent Mortgage that was taken out on this home.
Original Mortgage
$334,400
Outstanding Balance
$309,536
Interest Rate
2.8%
Mortgage Type
New Conventional
Estimated Equity
$84,800
Purchase Details
Closed on
Jun 22, 2018
Sold by
Smith Ronald L and Smith Beverly Busse
Bought by
Rapjack Shauna
Purchase Details
Closed on
Jul 25, 2006
Sold by
Lewis Teresa V
Bought by
Smith Ronald L and Smith Beverly Busse
Home Financials for this Owner
Home Financials are based on the most recent Mortgage that was taken out on this home.
Original Mortgage
$130,000
Interest Rate
6.62%
Mortgage Type
Unknown
Purchase Details
Closed on
Mar 31, 2003
Sold by
Lewis Richard C
Bought by
Lewis Teresa
Purchase Details
Closed on
Feb 1, 1990
Bought by
Smith Ronald L
Purchase Details
Closed on
Jan 1, 1978
Bought by
Smith Ronald L
Create a Home Valuation Report for This Property
The Home Valuation Report is an in-depth analysis detailing your home's value as well as a comparison with similar homes in the area
Home Values in the Area
Average Home Value in this Area
Purchase History
| Date | Buyer | Sale Price | Title Company |
|---|---|---|---|
| Bonner Eric L | $352,000 | First American Title | |
| Rapjack Shauna | $256,900 | Heritage Title Co | |
| Smith Ronald L | $170,000 | Security Title | |
| Lewis Teresa | -- | -- | |
| Smith Ronald L | -- | -- | |
| Smith Ronald L | -- | -- |
Source: Public Records
Mortgage History
| Date | Status | Borrower | Loan Amount |
|---|---|---|---|
| Open | Bonner Eric L | $334,400 | |
| Previous Owner | Smith Ronald L | $103,300 | |
| Previous Owner | Smith Ronald L | $130,000 | |
| Previous Owner | Lewis Teresa | $40,000 |
Source: Public Records
Tax History Compared to Growth
Tax History
| Year | Tax Paid | Tax Assessment Tax Assessment Total Assessment is a certain percentage of the fair market value that is determined by local assessors to be the total taxable value of land and additions on the property. | Land | Improvement |
|---|---|---|---|---|
| 2024 | $1,111 | $26,420 | $4,400 | $22,020 |
| 2023 | $1,111 | $26,420 | $4,400 | $22,020 |
| 2022 | $1,067 | $19,060 | $3,340 | $15,720 |
| 2021 | $1,157 | $19,600 | $3,430 | $16,170 |
| 2020 | $1,053 | $15,510 | $2,970 | $12,540 |
| 2019 | $1,047 | $15,510 | $2,970 | $12,540 |
| 2018 | $966 | $13,160 | $2,590 | $10,570 |
| 2017 | $915 | $13,160 | $2,590 | $10,570 |
| 2016 | $699 | $12,050 | $2,170 | $9,880 |
| 2015 | $696 | $12,050 | $2,170 | $9,880 |
| 2014 | $654 | $10,860 | $2,170 | $8,690 |
Source: Public Records
Map
Nearby Homes
- 4165 Sod House Trail
- 4879 S Splendid Cir
- 4974 Artistic Place
- 5050 N Splendid Cir
- 4990 Castledown Rd
- 4759 Picturesque Dr
- 4926 Castledown Rd
- 4340 Sammers View
- 4362 Susie View
- 5148 Peak Villa Heights
- 5102 Rainbow Harbour Cir
- 4768 S Gracemoor Cir
- 4135 Neat Place
- 4336 Adam Mark Point
- 5365 Rawhide Ln
- 4718 N Carefree Cir
- 4995 Picturesque Cir
- 5360 Wagon Master Dr
- 5305 Mountain Peak Point
- 5062 Barnes Rd