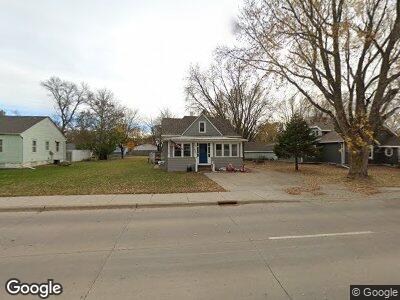
405 W Cedar St Beresford, SD 57004
Estimated Value: $166,000 - $301,000
5
Beds
1
Bath
1,720
Sq Ft
$123/Sq Ft
Est. Value
About This Home
This home is located at 405 W Cedar St, Beresford, SD 57004 and is currently estimated at $212,067, approximately $123 per square foot. 405 W Cedar St is a home located in Union County with nearby schools including Beresford Elementary School, Beresford Middle School, and Beresford High School.
Ownership History
Date
Name
Owned For
Owner Type
Purchase Details
Closed on
Jul 15, 2021
Sold by
Waterman Daniel R
Bought by
Dehaan Tanya Nicole
Current Estimated Value
Purchase Details
Closed on
Oct 3, 2018
Sold by
Ligman Jan and Ligman Richard
Bought by
Helland Joshua A and Helland Carla Mae
Home Financials for this Owner
Home Financials are based on the most recent Mortgage that was taken out on this home.
Original Mortgage
$77,600
Interest Rate
4.5%
Mortgage Type
New Conventional
Purchase Details
Closed on
Mar 22, 2005
Sold by
Secretary Of Hud
Bought by
Ligman Jan and Ligman Richard
Home Financials for this Owner
Home Financials are based on the most recent Mortgage that was taken out on this home.
Original Mortgage
$43,200
Interest Rate
5.71%
Mortgage Type
New Conventional
Create a Home Valuation Report for This Property
The Home Valuation Report is an in-depth analysis detailing your home's value as well as a comparison with similar homes in the area
Home Values in the Area
Average Home Value in this Area
Purchase History
| Date | Buyer | Sale Price | Title Company |
|---|---|---|---|
| Dehaan Tanya Nicole | $140,000 | -- | |
| Helland Joshua A | $80,000 | Stewart Title Company | |
| Ligman Jan | -- | None Available |
Source: Public Records
Mortgage History
| Date | Status | Borrower | Loan Amount |
|---|---|---|---|
| Previous Owner | Helland Joshua A | $77,600 | |
| Previous Owner | Ligman Jan | $43,200 |
Source: Public Records
Tax History Compared to Growth
Tax History
| Year | Tax Paid | Tax Assessment Tax Assessment Total Assessment is a certain percentage of the fair market value that is determined by local assessors to be the total taxable value of land and additions on the property. | Land | Improvement |
|---|---|---|---|---|
| 2024 | $1,973 | $142,351 | $29,768 | $112,583 |
| 2023 | $1,642 | $132,116 | $29,768 | $102,348 |
| 2022 | $1,464 | $101,642 | $22,913 | $78,729 |
| 2021 | $1,442 | $88,384 | $19,924 | $68,460 |
| 2020 | $1,436 | $85,124 | $19,924 | $65,200 |
| 2019 | $2,071 | $85,124 | $19,924 | $65,200 |
| 2018 | $2,076 | $99,884 | $19,924 | $79,960 |
| 2017 | $1,969 | $99,884 | $19,924 | $79,960 |
| 2016 | $2,133 | $90,804 | $18,113 | $72,691 |
| 2015 | $2,133 | $90,804 | $18,113 | $72,691 |
| 2014 | $2,003 | $90,804 | $18,113 | $72,691 |
| 2013 | $1,959 | $90,804 | $18,113 | $72,691 |
| 2012 | $1,959 | $90,804 | $18,113 | $72,691 |
Source: Public Records
Map
Nearby Homes