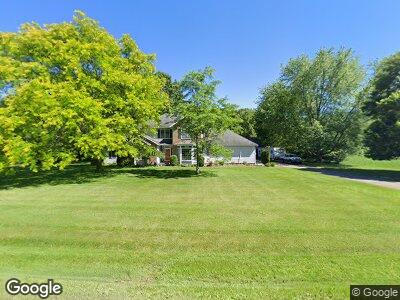
4059 Foxtail Trail Copley, OH 44321
Copley NeighborhoodEstimated Value: $628,000 - $666,000
4
Beds
3
Baths
3,134
Sq Ft
$206/Sq Ft
Est. Value
About This Home
This home is located at 4059 Foxtail Trail, Copley, OH 44321 and is currently estimated at $644,667, approximately $205 per square foot. 4059 Foxtail Trail is a home located in Summit County with nearby schools including Copley-Fairlawn Middle School, Copley High School, and Spring Garden Waldorf School.
Ownership History
Date
Name
Owned For
Owner Type
Purchase Details
Closed on
Aug 3, 2022
Sold by
Petersen Patricia S
Bought by
Petersen Jan D and Petersen Patricia S
Current Estimated Value
Home Financials for this Owner
Home Financials are based on the most recent Mortgage that was taken out on this home.
Original Mortgage
$883,500
Outstanding Balance
$881,961
Interest Rate
5.81%
Mortgage Type
Reverse Mortgage Home Equity Conversion Mortgage
Estimated Equity
-$237,294
Purchase Details
Closed on
Feb 18, 1999
Sold by
Kent Larry H and Kent Boni W
Bought by
Petersen Jan D and Petersen Patricia S
Purchase Details
Closed on
Aug 18, 1995
Sold by
Terry Ava Marie
Bought by
Larry H and Kent Boni W
Home Financials for this Owner
Home Financials are based on the most recent Mortgage that was taken out on this home.
Original Mortgage
$203,150
Interest Rate
6%
Mortgage Type
New Conventional
Create a Home Valuation Report for This Property
The Home Valuation Report is an in-depth analysis detailing your home's value as well as a comparison with similar homes in the area
Home Values in the Area
Average Home Value in this Area
Purchase History
| Date | Buyer | Sale Price | Title Company |
|---|---|---|---|
| Petersen Jan D | -- | Fnc Title Services | |
| Petersen Jan D | $282,500 | -- | |
| Larry H | $278,900 | -- |
Source: Public Records
Mortgage History
| Date | Status | Borrower | Loan Amount |
|---|---|---|---|
| Open | Petersen Jan D | $883,500 | |
| Previous Owner | Petersen Jan D | $210,000 | |
| Previous Owner | Petersen Jan D | $190,283 | |
| Previous Owner | Petersen Jan | $49,800 | |
| Previous Owner | Petersen Jan D | $198,000 | |
| Previous Owner | Petersen Jan D | $200,000 | |
| Previous Owner | Petersen Jan D | $200,000 | |
| Previous Owner | Larry H | $203,150 |
Source: Public Records
Tax History Compared to Growth
Tax History
| Year | Tax Paid | Tax Assessment Tax Assessment Total Assessment is a certain percentage of the fair market value that is determined by local assessors to be the total taxable value of land and additions on the property. | Land | Improvement |
|---|---|---|---|---|
| 2025 | $8,103 | $160,115 | $29,201 | $130,914 |
| 2024 | $8,103 | $160,115 | $29,201 | $130,914 |
| 2023 | $8,103 | $160,115 | $29,201 | $130,914 |
| 2022 | $7,942 | $129,892 | $23,548 | $106,344 |
| 2021 | $7,336 | $129,892 | $23,548 | $106,344 |
| 2020 | $7,164 | $129,890 | $23,550 | $106,340 |
| 2019 | $6,966 | $114,910 | $23,310 | $91,600 |
| 2018 | $6,630 | $114,910 | $23,310 | $91,600 |
| 2017 | $6,676 | $114,910 | $23,310 | $91,600 |
| 2016 | $6,666 | $111,390 | $23,310 | $88,080 |
| 2015 | $6,676 | $111,390 | $23,310 | $88,080 |
| 2014 | $6,631 | $111,390 | $23,310 | $88,080 |
| 2013 | $6,467 | $111,900 | $23,310 | $88,590 |
Source: Public Records
Map
Nearby Homes
- 4366 Ridgewood Rd
- 763 Kensington Way
- 673 Southampton Ct
- 4557 Conestoga Trail
- 414 Kings Ct
- 545 Redfield Ln
- 4345 Cypress Ct
- 523 Arbor Ln
- 494 Arbor Ln
- 1471 Belle Meade Dr
- 4572 Litchfield Dr
- 3832 S Sunnyfield Dr
- V/L Copley Rd
- 4339 Sierra Dr
- 0 Kumho Dr
- 305 Willow Green Trail
- 640 S Cleveland Massillon Rd
- 3800 Rosemont Blvd Unit 106F
- 3800 Rosemont Blvd Unit 101-D
- 4721 Copley Rd