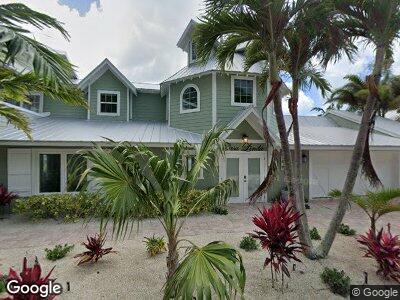
406 21st Place Bradenton Beach, FL 34217
Bradenton Beach NeighborhoodEstimated Value: $2,359,000 - $2,527,000
4
Beds
4
Baths
2,625
Sq Ft
$925/Sq Ft
Est. Value
About This Home
This home is located at 406 21st Place, Bradenton Beach, FL 34217 and is currently estimated at $2,427,286, approximately $924 per square foot. 406 21st Place is a home located in Manatee County with nearby schools including Anna Maria Elementary School, Martha B. King Middle School, and Bayshore High School.
Ownership History
Date
Name
Owned For
Owner Type
Purchase Details
Closed on
Dec 19, 2024
Sold by
By The Shore Investments Ii Llc
Bought by
209 Church Street Llc
Current Estimated Value
Purchase Details
Closed on
Dec 19, 2012
Sold by
Cfi Usa Inc
Bought by
By The Shore Investments Ii Llc
Purchase Details
Closed on
Jul 24, 2009
Sold by
Pashley Warren J and Pashley Karen E
Bought by
Cfi Usa Inc
Purchase Details
Closed on
Apr 20, 2006
Sold by
Stumpf Robert and Stumpf Dolores M
Bought by
Pashley Warren J and Pashley Karen E
Home Financials for this Owner
Home Financials are based on the most recent Mortgage that was taken out on this home.
Original Mortgage
$900,000
Interest Rate
6.28%
Mortgage Type
Fannie Mae Freddie Mac
Create a Home Valuation Report for This Property
The Home Valuation Report is an in-depth analysis detailing your home's value as well as a comparison with similar homes in the area
Home Values in the Area
Average Home Value in this Area
Purchase History
| Date | Buyer | Sale Price | Title Company |
|---|---|---|---|
| 209 Church Street Llc | $2,500,000 | None Listed On Document | |
| By The Shore Investments Ii Llc | $850,000 | Attorney | |
| Cfi Usa Inc | $1,000,000 | Homestead Title Of Pinellas | |
| Pashley Warren J | $1,275,000 | Title Insurance Closing Svcs |
Source: Public Records
Mortgage History
| Date | Status | Borrower | Loan Amount |
|---|---|---|---|
| Previous Owner | Pashley Warren J | $900,000 | |
| Previous Owner | Stumpf Robert | $100,000 |
Source: Public Records
Tax History Compared to Growth
Tax History
| Year | Tax Paid | Tax Assessment Tax Assessment Total Assessment is a certain percentage of the fair market value that is determined by local assessors to be the total taxable value of land and additions on the property. | Land | Improvement |
|---|---|---|---|---|
| 2024 | $31,681 | $2,262,671 | $1,296,939 | $965,732 |
| 2023 | $31,497 | $2,265,275 | $1,296,939 | $968,336 |
| 2022 | $27,297 | $1,900,986 | $1,109,680 | $791,306 |
| 2021 | $22,467 | $1,386,714 | $970,970 | $415,744 |
| 2020 | $22,694 | $1,343,828 | $1,040,325 | $303,503 |
| 2019 | $22,703 | $1,330,555 | $1,040,325 | $290,230 |
| 2018 | $22,035 | $1,310,256 | $1,040,325 | $269,931 |
| 2017 | $19,270 | $1,234,846 | $0 | $0 |
| 2016 | $17,610 | $1,109,521 | $0 | $0 |
| 2015 | $14,804 | $980,393 | $0 | $0 |
| 2014 | $14,804 | $883,654 | $0 | $0 |
| 2013 | $13,430 | $772,936 | $587,250 | $185,686 |
Source: Public Records
Map
Nearby Homes
- 2203 Avenue B
- 3015 Avenue B
- 2208 Avenue A
- 2102 Avenue B
- 401 20th Place
- 2206 Avenue B
- 2213 Avenue B
- 1801 Gulf Dr N Unit 184
- 1801 Gulf Dr N Unit 175
- 1801 Gulf Dr N Unit 275
- 1801 Gulf Dr N Unit 248
- 2203 Avenue C Unit B
- 303 Gulf Dr N Unit A
- 2211 Avenue C
- 1900 Gulf Dr N Unit 1
- 1900 Gulf Dr N Unit 4
- 2306 Canasta Dr
- 2300 Avenue B
- 2210 Avenue C Unit A & B
- 1906 Gulf Dr N Unit 106