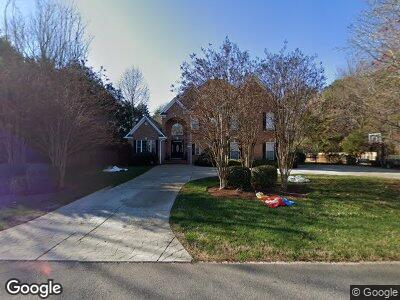
406 Canvasback Rd Mooresville, NC 28117
Lake Norman NeighborhoodEstimated Value: $877,240 - $1,051,000
4
Beds
4
Baths
4,213
Sq Ft
$220/Sq Ft
Est. Value
About This Home
This home is located at 406 Canvasback Rd, Mooresville, NC 28117 and is currently estimated at $928,310, approximately $220 per square foot. 406 Canvasback Rd is a home located in Iredell County with nearby schools including Lake Norman Elementary School and Lake Norman High School.
Ownership History
Date
Name
Owned For
Owner Type
Purchase Details
Closed on
Oct 6, 2013
Sold by
Coody John and Coody Meruyet
Bought by
Burge Kevin Mark
Current Estimated Value
Home Financials for this Owner
Home Financials are based on the most recent Mortgage that was taken out on this home.
Original Mortgage
$401,850
Interest Rate
4.13%
Mortgage Type
New Conventional
Purchase Details
Closed on
Nov 12, 2010
Sold by
Zdrentan Dumitru and Zdrentan Lidia
Bought by
Coody John and Coody Meruyet
Home Financials for this Owner
Home Financials are based on the most recent Mortgage that was taken out on this home.
Original Mortgage
$337,500
Interest Rate
4.37%
Mortgage Type
New Conventional
Purchase Details
Closed on
Sep 17, 2009
Sold by
Zdrentan Wesley and Zdrentan Lidia
Bought by
Zdrentan Dumitru and Zdrentan Lidia
Purchase Details
Closed on
Jan 24, 2006
Sold by
Honeycutt Arlene Dean
Bought by
Zdrentan Wesley
Purchase Details
Closed on
Mar 1, 1992
Create a Home Valuation Report for This Property
The Home Valuation Report is an in-depth analysis detailing your home's value as well as a comparison with similar homes in the area
Home Values in the Area
Average Home Value in this Area
Purchase History
| Date | Buyer | Sale Price | Title Company |
|---|---|---|---|
| Burge Kevin Mark | $423,000 | None Available | |
| Coody John | $375,000 | None Available | |
| Zdrentan Dumitru | -- | None Available | |
| Zdrentan Wesley | $55,000 | None Available | |
| -- | -- | -- |
Source: Public Records
Mortgage History
| Date | Status | Borrower | Loan Amount |
|---|---|---|---|
| Open | Burge Kevin Mark | $417,400 | |
| Closed | Burge Kevin Mark | $250,000 | |
| Previous Owner | Burge Kevin Mark | $401,850 | |
| Previous Owner | Coody John | $337,500 |
Source: Public Records
Tax History Compared to Growth
Tax History
| Year | Tax Paid | Tax Assessment Tax Assessment Total Assessment is a certain percentage of the fair market value that is determined by local assessors to be the total taxable value of land and additions on the property. | Land | Improvement |
|---|---|---|---|---|
| 2024 | $3,833 | $639,420 | $71,250 | $568,170 |
| 2023 | $3,833 | $639,420 | $71,250 | $568,170 |
| 2022 | $3,058 | $477,700 | $61,750 | $415,950 |
| 2021 | $3,054 | $477,700 | $61,750 | $415,950 |
| 2020 | $3,054 | $477,700 | $61,750 | $415,950 |
| 2019 | $3,006 | $477,700 | $61,750 | $415,950 |
| 2018 | $2,524 | $413,770 | $52,250 | $361,520 |
| 2017 | $2,524 | $413,770 | $52,250 | $361,520 |
| 2016 | $2,524 | $413,770 | $52,250 | $361,520 |
| 2015 | $2,524 | $413,770 | $52,250 | $361,520 |
| 2014 | $2,298 | $404,660 | $52,250 | $352,410 |
Source: Public Records
Map
Nearby Homes
- 241 Spring Run Dr
- 103 Patience Place Ln
- 332 Canvasback Rd
- 341 Canvasback Rd
- 133 Broadbill Dr
- 118 Broadbill Dr
- 189 Billy Jo Rd
- 145 Bridlepath Ln
- 400 Canvasback Rd
- 209 Woodstream Cir
- 286 Canvasback Rd
- 325 Wood Duck Loop
- 150 Driftwood Dr
- 0 Bluewing Ln Unit 268 CAR4151040
- 235 Commodore Loop
- 158 Cove View Dr
- 138 Continental Dr
- 309 Commodore Loop
- 317 Commodore Loop
- 130 Hopedale Ct