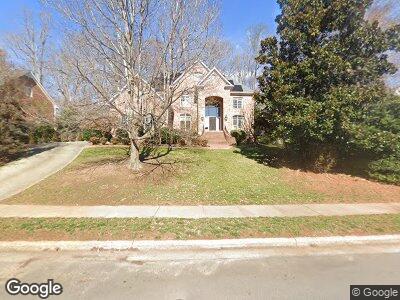
406 Midenhall Way Cary, NC 27513
Weston NeighborhoodEstimated Value: $1,272,188 - $1,551,000
5
Beds
7
Baths
4,950
Sq Ft
$274/Sq Ft
Est. Value
About This Home
This home is located at 406 Midenhall Way, Cary, NC 27513 and is currently estimated at $1,355,797, approximately $273 per square foot. 406 Midenhall Way is a home located in Wake County with nearby schools including Reedy Creek Elementary School, Reedy Creek Magnet Middle School, and Cary High School.
Ownership History
Date
Name
Owned For
Owner Type
Purchase Details
Closed on
Jul 18, 2008
Sold by
Wingo Mitchell Scot and Wingo Kristin V
Bought by
Singh Munindar P and Singh Mona
Current Estimated Value
Home Financials for this Owner
Home Financials are based on the most recent Mortgage that was taken out on this home.
Original Mortgage
$640,000
Interest Rate
6.03%
Mortgage Type
Purchase Money Mortgage
Purchase Details
Closed on
Apr 14, 1999
Sold by
Ward Stephen M
Bought by
Wingo Mitchell Scot and Wingo Kristin
Home Financials for this Owner
Home Financials are based on the most recent Mortgage that was taken out on this home.
Original Mortgage
$480,000
Interest Rate
6.84%
Create a Home Valuation Report for This Property
The Home Valuation Report is an in-depth analysis detailing your home's value as well as a comparison with similar homes in the area
Home Values in the Area
Average Home Value in this Area
Purchase History
| Date | Buyer | Sale Price | Title Company |
|---|---|---|---|
| Singh Munindar P | $800,000 | None Available | |
| Wingo Mitchell Scot | $627,500 | -- |
Source: Public Records
Mortgage History
| Date | Status | Borrower | Loan Amount |
|---|---|---|---|
| Open | Singh Munindar P | $287,000 | |
| Closed | Singh Munindar P | $200,000 | |
| Closed | Singh Munindar P | $150,000 | |
| Closed | Singh Munindar P | $361,000 | |
| Closed | Singh Munindar P | $417,000 | |
| Closed | Singh Munindar P | $100,000 | |
| Closed | Singh Munindar P | $640,000 | |
| Previous Owner | Markowitz Michael | $448,000 | |
| Previous Owner | Wingo Mitchell Scot | $480,000 |
Source: Public Records
Tax History Compared to Growth
Tax History
| Year | Tax Paid | Tax Assessment Tax Assessment Total Assessment is a certain percentage of the fair market value that is determined by local assessors to be the total taxable value of land and additions on the property. | Land | Improvement |
|---|---|---|---|---|
| 2024 | $8,900 | $1,058,994 | $250,000 | $808,994 |
| 2023 | $7,338 | $730,340 | $140,000 | $590,340 |
| 2022 | $7,064 | $730,340 | $140,000 | $590,340 |
| 2021 | $6,922 | $730,340 | $140,000 | $590,340 |
| 2020 | $6,958 | $730,340 | $140,000 | $590,340 |
| 2019 | $8,003 | $745,553 | $140,000 | $605,553 |
| 2018 | $7,508 | $745,553 | $140,000 | $605,553 |
| 2017 | $7,215 | $745,553 | $140,000 | $605,553 |
| 2016 | $7,106 | $745,553 | $140,000 | $605,553 |
| 2015 | $6,755 | $684,149 | $160,000 | $524,149 |
| 2014 | $6,369 | $684,149 | $160,000 | $524,149 |
Source: Public Records
Map
Nearby Homes
- 104 Dilworth Ct
- 102 Pinehill Way
- 113 Eyemouth Ct
- 213 Beechtree Dr
- 515 Bexley Bluff Ln
- 508 Spencer Crest Ct
- 202 Homestead Dr
- 103 Loch Ryan Way
- 411 Gooseneck Dr Unit B6
- 207 Wyatts Pond Ln
- 505 Gooseneck Dr Unit A1
- 505 Gooseneck Dr Unit B1
- 501 Gooseneck Dr Unit B6
- 302 Rushingwater Dr
- 100 Sandy Hook Way
- 407 Gooseneck Dr Unit A2
- 403 Gooseneck Dr Unit A1
- 104 Montauk Point Place
- 102 Choptank Ct Unit B5
- 122 Waterfall Ct