
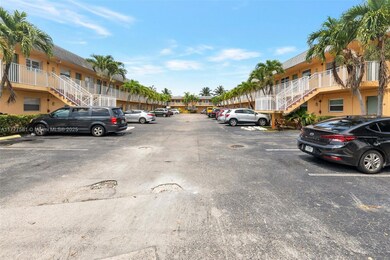
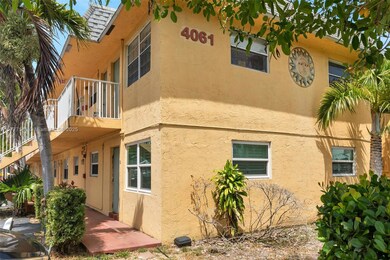
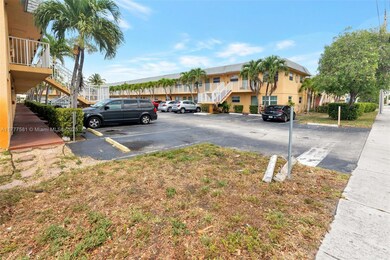
El Sol Condominium 4061 N Dixie Hwy Unit 29 Oakland Park, FL 33334
Central Oakland Park NeighborhoodEstimated payment $1,510/month
Total Views
758
2
Beds
1
Bath
650
Sq Ft
$246
Price per Sq Ft
Highlights
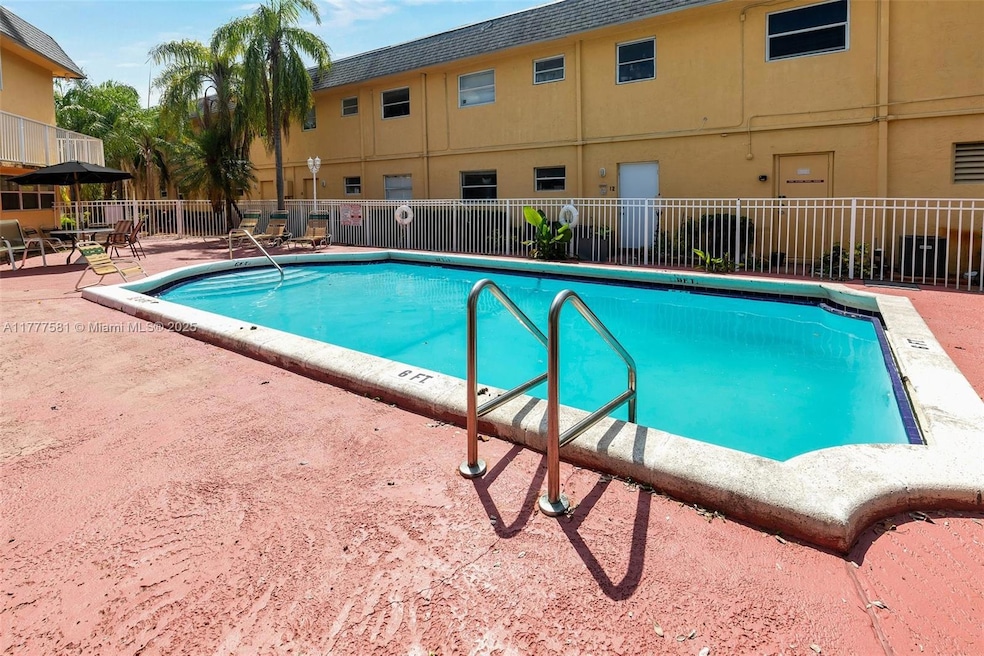
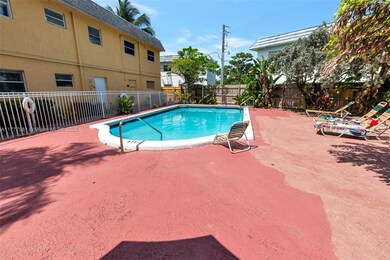
- Community Pool
- Tile Flooring
- Central Heating and Cooling System
- Views
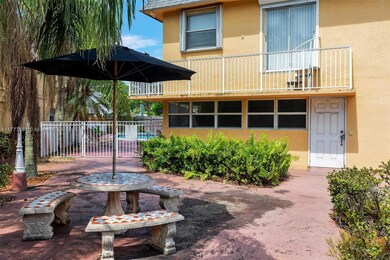
- Guest Parking
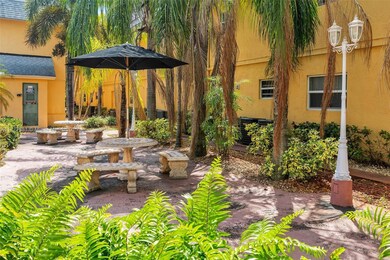
- 1-minute walk to Jaco Pastorius Park
About This Home
2 bed 1 bath condo in excellent location just in front of a city park and walking distance of stores and restaurants! Rented at $1,650 till 11-30-2025
Property Details
Home Type
- Condominium
Est. Annual Taxes
- $3,346
Year Built
- Built in 1972
HOA Fees
- $338 Monthly HOA Fees
Parking
- Guest Parking
Home Design
- Concrete Block And Stucco Construction
Interior Spaces
- 650 Sq Ft Home
- 2-Story Property
- Tile Flooring
- Dryer
- Property Views
Kitchen
- Microwave
- Dishwasher
- Disposal
Bedrooms and Bathrooms
- 2 Bedrooms
- 1 Full Bathroom
Utilities
- Central Heating and Cooling System
Listing and Financial Details
- Assessor Parcel Number 494223AJ0530
Community Details
Overview
- El Sol At Main Street Con Condos
- El Sol At Main Street Con Subdivision
Recreation
Pet Policy
- Breed Restrictions
Map
About El Sol Condominium
Create a Home Valuation Report for This Property
The Home Valuation Report is an in-depth analysis detailing your home's value as well as a comparison with similar homes in the area
Home Values in the Area
Average Home Value in this Area
Tax History
| Year | Tax Paid | Tax Assessment Tax Assessment Total Assessment is a certain percentage of the fair market value that is determined by local assessors to be the total taxable value of land and additions on the property. | Land | Improvement |
|---|---|---|---|---|
| 2025 | $3,346 | $141,380 | -- | -- |
| 2024 | $3,079 | $141,380 | -- | -- |
| 2023 | $3,079 | $116,850 | $0 | $0 |
| 2022 | $2,867 | $106,230 | $0 | $0 |
| 2021 | $2,344 | $96,580 | $0 | $0 |
| 2020 | $2,195 | $104,840 | $10,480 | $94,360 |
| 2019 | $2,002 | $94,100 | $9,410 | $84,690 |
| 2018 | $1,732 | $72,570 | $7,260 | $65,310 |
| 2017 | $1,748 | $70,330 | $0 | $0 |
| 2016 | $1,621 | $63,940 | $0 | $0 |
| 2015 | $1,555 | $59,240 | $0 | $0 |
| 2014 | $1,362 | $49,890 | $0 | $0 |
| 2013 | -- | $41,140 | $4,110 | $37,030 |
Source: Public Records
Property History
| Date | Event | Price | Change | Sq Ft Price |
|---|---|---|---|---|
| 04/15/2025 04/15/25 | Price Changed | $160,000 | -5.9% | $246 / Sq Ft |
| 04/04/2025 04/04/25 | For Sale | $170,000 | 0.0% | $262 / Sq Ft |
| 12/02/2024 12/02/24 | Rented | $1,650 | 0.0% | -- |
| 11/14/2024 11/14/24 | Under Contract | -- | -- | -- |
| 10/29/2024 10/29/24 | For Rent | $1,650 | 0.0% | -- |
| 10/07/2024 10/07/24 | Off Market | $1,650 | -- | -- |
| 10/04/2024 10/04/24 | For Rent | $1,650 | 0.0% | -- |
| 10/02/2024 10/02/24 | Under Contract | -- | -- | -- |
| 09/24/2024 09/24/24 | Price Changed | $1,650 | -5.7% | $3 / Sq Ft |
| 08/15/2024 08/15/24 | Price Changed | $1,750 | +2.9% | $3 / Sq Ft |
| 08/12/2024 08/12/24 | For Rent | $1,700 | +6.3% | -- |
| 07/01/2023 07/01/23 | Rented | $1,600 | 0.0% | -- |
| 06/22/2023 06/22/23 | Under Contract | -- | -- | -- |
| 06/21/2023 06/21/23 | Price Changed | $1,600 | -3.0% | $2 / Sq Ft |
| 06/16/2023 06/16/23 | Price Changed | $1,650 | -2.9% | $3 / Sq Ft |
| 06/01/2023 06/01/23 | Price Changed | $1,700 | -2.9% | $3 / Sq Ft |
| 05/25/2023 05/25/23 | Price Changed | $1,750 | -2.8% | $3 / Sq Ft |
| 05/15/2023 05/15/23 | For Rent | $1,800 | 0.0% | -- |
| 05/02/2023 05/02/23 | Under Contract | -- | -- | -- |
| 04/15/2023 04/15/23 | For Rent | $1,800 | 0.0% | -- |
| 04/10/2023 04/10/23 | Under Contract | -- | -- | -- |
| 02/18/2023 02/18/23 | For Rent | $1,800 | +56.5% | -- |
| 03/28/2019 03/28/19 | Rented | $1,150 | 0.0% | -- |
| 02/26/2019 02/26/19 | Under Contract | -- | -- | -- |
| 02/01/2019 02/01/19 | For Rent | $1,150 | 0.0% | -- |
| 01/31/2019 01/31/19 | Rented | $1,150 | -4.2% | -- |
| 01/01/2019 01/01/19 | Under Contract | -- | -- | -- |
| 12/03/2018 12/03/18 | For Rent | $1,200 | +25.7% | -- |
| 08/11/2014 08/11/14 | Rented | $955 | -4.5% | -- |
| 08/11/2014 08/11/14 | For Rent | $1,000 | 0.0% | -- |
| 07/25/2014 07/25/14 | Sold | $60,000 | -3.2% | $92 / Sq Ft |
| 06/25/2014 06/25/14 | Pending | -- | -- | -- |
| 06/18/2014 06/18/14 | For Sale | $62,000 | +9.3% | $95 / Sq Ft |
| 01/15/2014 01/15/14 | Sold | $56,700 | +9.0% | $87 / Sq Ft |
| 11/12/2013 11/12/13 | Pending | -- | -- | -- |
| 10/24/2013 10/24/13 | For Sale | $52,000 | -8.3% | $80 / Sq Ft |
| 10/23/2013 10/23/13 | Off Market | $56,700 | -- | -- |
| 10/18/2013 10/18/13 | For Sale | $52,000 | -- | $80 / Sq Ft |
Source: MIAMI REALTORS® MLS
Deed History
| Date | Type | Sale Price | Title Company |
|---|---|---|---|
| Warranty Deed | $77,000 | None Available | |
| Warranty Deed | $60,000 | Attorney | |
| Special Warranty Deed | $56,700 | Buyers Title Inc | |
| Special Warranty Deed | $56,700 | Buyers Title Inc | |
| Trustee Deed | $41,200 | None Available | |
| Special Warranty Deed | $147,500 | Attorney |
Source: Public Records
Mortgage History
| Date | Status | Loan Amount | Loan Type |
|---|---|---|---|
| Previous Owner | $118,000 | Negative Amortization |
Source: Public Records
Similar Homes in the area
Source: MIAMI REALTORS® MLS
MLS Number: A11777581
APN: 49-42-23-AJ-0530
Disclaimer: Certain information contained herein is derived from information provided by parties other than Homes.com. All information provided is deemed reliable, but is not guaranteed to be accurate and should be independently verified.
![]() IDX information is provided exclusively for personal, non-commercial use, and may not be used for any purpose other than to identify prospective properties consumers may be interested in purchasing. Information is deemed reliable but not guaranteed.
IDX information is provided exclusively for personal, non-commercial use, and may not be used for any purpose other than to identify prospective properties consumers may be interested in purchasing. Information is deemed reliable but not guaranteed.
Nearby Homes
- 4071 N Dixie Hwy Unit 19
- 4061 N Dixie Hwy Unit 29
- 4081 N Dixie Hwy Unit 13
- 4061 N Dixie Hwy Unit 12
- 4061 N Dixie Hwy Unit 3
- 4228 N Dixie Hwy Unit 106
- 4220 N Dixie Hwy Unit 75
- 925 NE 40th St
- 4236 N Dixie Hwy Unit 132
- 901 NE 40th St
- 901 NE 39th St
- 872 NE 40th St
- 883 NE 39th St
- 4208 N Dixie Hwy Unit 23
- 920 NE 39th St
- 4212 N Dixie Hwy Unit 40
- 898 NE 39th St
- 3960 NE 8th Ave
- 754 NE 40th St
- 4212 NE 7th Terrace Unit 7