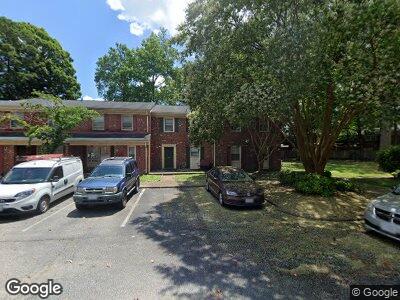
407 Hustings Ln Unit C Newport News, VA 23608
Epes NeighborhoodEstimated Value: $176,000 - $194,441
3
Beds
2
Baths
1,392
Sq Ft
$133/Sq Ft
Est. Value
About This Home
This home is located at 407 Hustings Ln Unit C, Newport News, VA 23608 and is currently estimated at $185,110, approximately $132 per square foot. 407 Hustings Ln Unit C is a home located in Newport News City with nearby schools including Willis A. Jenkins Elementary School, Mary Passage Middle School, and Denbigh High School.
Ownership History
Date
Name
Owned For
Owner Type
Purchase Details
Closed on
Feb 23, 2024
Sold by
Billet Eric J
Bought by
Battle Lylliane
Current Estimated Value
Home Financials for this Owner
Home Financials are based on the most recent Mortgage that was taken out on this home.
Original Mortgage
$181,827
Outstanding Balance
$180,004
Interest Rate
6.6%
Mortgage Type
VA
Estimated Equity
$5,106
Purchase Details
Closed on
Jul 17, 2006
Sold by
Jones Lisa Renee
Bought by
Billet Eric J
Home Financials for this Owner
Home Financials are based on the most recent Mortgage that was taken out on this home.
Original Mortgage
$133,019
Interest Rate
6.67%
Mortgage Type
New Conventional
Purchase Details
Closed on
Mar 5, 1999
Sold by
Hoffler Marvin L
Bought by
Smith Lisa Renee N
Home Financials for this Owner
Home Financials are based on the most recent Mortgage that was taken out on this home.
Original Mortgage
$50,550
Interest Rate
6.76%
Create a Home Valuation Report for This Property
The Home Valuation Report is an in-depth analysis detailing your home's value as well as a comparison with similar homes in the area
Home Values in the Area
Average Home Value in this Area
Purchase History
| Date | Buyer | Sale Price | Title Company |
|---|---|---|---|
| Battle Lylliane | $178,000 | Universal Title | |
| Billet Eric J | $135,000 | -- | |
| Smith Lisa Renee N | $51,000 | -- |
Source: Public Records
Mortgage History
| Date | Status | Borrower | Loan Amount |
|---|---|---|---|
| Open | Battle Lylliane | $181,827 | |
| Previous Owner | Billet Eric J | $133,019 | |
| Previous Owner | Smith Lisa Renee N | $50,550 |
Source: Public Records
Tax History Compared to Growth
Tax History
| Year | Tax Paid | Tax Assessment Tax Assessment Total Assessment is a certain percentage of the fair market value that is determined by local assessors to be the total taxable value of land and additions on the property. | Land | Improvement |
|---|---|---|---|---|
| 2024 | $1,936 | $164,100 | $39,100 | $125,000 |
| 2023 | $1,627 | $146,600 | $34,000 | $112,600 |
| 2022 | $1,627 | $123,300 | $29,300 | $94,000 |
| 2021 | $1,280 | $104,900 | $22,500 | $82,400 |
| 2020 | $1,224 | $88,300 | $18,000 | $70,300 |
| 2019 | $1,163 | $83,700 | $18,000 | $65,700 |
| 2018 | $1,137 | $81,800 | $18,000 | $63,800 |
| 2017 | $1,137 | $81,800 | $18,000 | $63,800 |
| 2016 | $1,133 | $81,800 | $18,000 | $63,800 |
| 2015 | $1,127 | $81,800 | $18,000 | $63,800 |
| 2014 | $1,137 | $85,200 | $18,000 | $67,200 |
Source: Public Records
Map
Nearby Homes
- 409 Hustings Ln Unit E
- 402 Hustings Ln Unit E
- 404 Hustings Ln Unit E
- 371 Advocate Ct
- 371 Advocate Ct Unit A
- 301 Advocate Ct Unit A
- 396 Circuit Ln Unit C
- 14501 Old Courthouse Way
- 388 Deputy Ln Unit A
- 294 Circuit Ln Unit E
- 304 Circuit Ln Unit A
- 385 Georgetown Loop
- 303 Circuit Ln Unit A
- 398 Georgetown Loop
- 355 Jonathan Ct
- 14375 Old Courthouse Way
- 924 Lucas Creek Rd Unit 4
- 513 Parliament Ln
- 378 Green Meadows Dr
- 333 Bexley Park Way