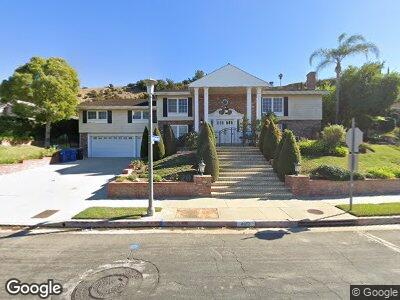
4072 Alonzo Ave Encino, CA 91316
Tarzana NeighborhoodEstimated Value: $2,934,643 - $3,920,000
5
Beds
5
Baths
5,459
Sq Ft
$604/Sq Ft
Est. Value
About This Home
This home is located at 4072 Alonzo Ave, Encino, CA 91316 and is currently estimated at $3,296,161, approximately $603 per square foot. 4072 Alonzo Ave is a home located in Los Angeles County with nearby schools including Gaspar De Portola Middle School, Nestle Avenue Charter, and Encino Charter Elementary.
Ownership History
Date
Name
Owned For
Owner Type
Purchase Details
Closed on
Sep 26, 2023
Sold by
Zeng Weiping
Bought by
Gong Qian
Current Estimated Value
Home Financials for this Owner
Home Financials are based on the most recent Mortgage that was taken out on this home.
Original Mortgage
$1,499,900
Outstanding Balance
$1,475,272
Interest Rate
7%
Mortgage Type
New Conventional
Estimated Equity
$1,682,115
Purchase Details
Closed on
Aug 28, 2023
Sold by
Nassif Survivors Trust
Bought by
Gong Qian
Home Financials for this Owner
Home Financials are based on the most recent Mortgage that was taken out on this home.
Original Mortgage
$1,499,900
Outstanding Balance
$1,475,272
Interest Rate
7%
Mortgage Type
New Conventional
Estimated Equity
$1,682,115
Purchase Details
Closed on
Oct 19, 2015
Sold by
Nassif Farid H and The Nassif Family Trust
Bought by
The Nassif Survivors Trust
Purchase Details
Closed on
Mar 22, 2011
Sold by
Nassif Farid and Nassif Gloria
Bought by
Nassif Farid H and Nassif Gloria A
Create a Home Valuation Report for This Property
The Home Valuation Report is an in-depth analysis detailing your home's value as well as a comparison with similar homes in the area
Home Values in the Area
Average Home Value in this Area
Purchase History
| Date | Buyer | Sale Price | Title Company |
|---|---|---|---|
| Gong Qian | -- | Lawyers Title Company | |
| Gong Qian | $2,880,000 | Lawyers Title | |
| The Nassif Survivors Trust | -- | None Available | |
| Nassif Farid H | -- | None Available |
Source: Public Records
Mortgage History
| Date | Status | Borrower | Loan Amount |
|---|---|---|---|
| Open | Gong Qian | $1,499,900 | |
| Previous Owner | Nassif Farid H | $383,381 | |
| Previous Owner | Nassif Farid | $444,000 | |
| Previous Owner | Nassif Farid | $446,000 |
Source: Public Records
Tax History Compared to Growth
Tax History
| Year | Tax Paid | Tax Assessment Tax Assessment Total Assessment is a certain percentage of the fair market value that is determined by local assessors to be the total taxable value of land and additions on the property. | Land | Improvement |
|---|---|---|---|---|
| 2024 | $35,352 | $2,880,000 | $2,159,800 | $720,200 |
| 2023 | $17,597 | $1,407,440 | $703,720 | $703,720 |
| 2022 | $16,810 | $1,379,844 | $689,922 | $689,922 |
| 2021 | $16,586 | $1,352,790 | $676,395 | $676,395 |
| 2019 | $16,096 | $1,312,668 | $656,334 | $656,334 |
| 2018 | $15,925 | $1,286,930 | $643,465 | $643,465 |
| 2016 | $15,179 | $1,236,960 | $618,480 | $618,480 |
| 2015 | $14,960 | $1,218,380 | $609,190 | $609,190 |
| 2014 | $15,014 | $1,194,514 | $597,257 | $597,257 |
Source: Public Records
Map
Nearby Homes
- 4060 Alonzo Ave
- 18045 Sweet Elm Dr
- 4167 Alonzo Ave
- 18141 Green Meadow Dr
- 3819 Vista Linda Dr
- 18116 Deer View Ct
- 18155 Lake Encino Dr
- 4501 Grimes Place
- 18164 Chardon Cir
- 4450 Coronet Dr
- 4533 Grimes Place
- 6113 Marbella Ln
- 18310 Karen Dr
- 18319 Karen Dr
- 18500 Saint Moritz Dr
- 4561 Gable Dr
- 4545 Alonzo Ave
- 3901 Rock Hampton Dr
- 4551 Lindley Ave
- 4637 Dunas Ln