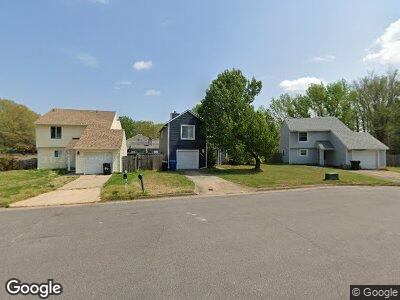
4081 Sherman Oaks Ave Virginia Beach, VA 23456
Landstown NeighborhoodEstimated Value: $387,000 - $436,000
3
Beds
3
Baths
1,751
Sq Ft
$231/Sq Ft
Est. Value
About This Home
This home is located at 4081 Sherman Oaks Ave, Virginia Beach, VA 23456 and is currently estimated at $404,874, approximately $231 per square foot. 4081 Sherman Oaks Ave is a home located in Virginia Beach City with nearby schools including New Castle Elementary School, Landstown Middle School, and Landstown High School.
Ownership History
Date
Name
Owned For
Owner Type
Purchase Details
Closed on
Feb 3, 2021
Sold by
Owen Edison C
Bought by
Cucciarre Stuligross Mikaelan
Current Estimated Value
Home Financials for this Owner
Home Financials are based on the most recent Mortgage that was taken out on this home.
Original Mortgage
$250,000
Outstanding Balance
$225,779
Interest Rate
2.6%
Mortgage Type
New Conventional
Estimated Equity
$179,095
Purchase Details
Closed on
Sep 28, 2017
Sold by
Tunney Michael T and Tunney Jenny L
Bought by
Owen Edison C
Home Financials for this Owner
Home Financials are based on the most recent Mortgage that was taken out on this home.
Original Mortgage
$265,590
Interest Rate
3.89%
Mortgage Type
VA
Purchase Details
Closed on
Mar 11, 2013
Sold by
Moscoe John S
Bought by
Tunney Michael T and Grondin Jenny L
Home Financials for this Owner
Home Financials are based on the most recent Mortgage that was taken out on this home.
Original Mortgage
$204,232
Interest Rate
3.25%
Mortgage Type
FHA
Create a Home Valuation Report for This Property
The Home Valuation Report is an in-depth analysis detailing your home's value as well as a comparison with similar homes in the area
Home Values in the Area
Average Home Value in this Area
Purchase History
| Date | Buyer | Sale Price | Title Company |
|---|---|---|---|
| Cucciarre Stuligross Mikaelan | $292,000 | Fidelity National Ttl Ins Co | |
| Owen Edison C | $260,000 | Landmark Title Llc | |
| Tunney Michael T | $208,000 | -- |
Source: Public Records
Mortgage History
| Date | Status | Borrower | Loan Amount |
|---|---|---|---|
| Open | Cucciarre Stuligross Mikaelan | $250,000 | |
| Previous Owner | Owen Edison C | $265,590 | |
| Previous Owner | Tunney Michael T | $24,836 | |
| Previous Owner | Tunney Michael T | $204,232 |
Source: Public Records
Tax History Compared to Growth
Tax History
| Year | Tax Paid | Tax Assessment Tax Assessment Total Assessment is a certain percentage of the fair market value that is determined by local assessors to be the total taxable value of land and additions on the property. | Land | Improvement |
|---|---|---|---|---|
| 2024 | $3,455 | $356,200 | $115,000 | $241,200 |
| 2023 | $3,425 | $346,000 | $108,000 | $238,000 |
| 2022 | $3,141 | $317,300 | $98,000 | $219,300 |
| 2021 | $2,770 | $279,800 | $85,000 | $194,800 |
| 2020 | $2,673 | $262,700 | $85,000 | $177,700 |
| 2019 | $2,638 | $251,700 | $83,000 | $168,700 |
| 2018 | $2,523 | $251,700 | $83,000 | $168,700 |
| 2017 | $2,301 | $229,500 | $83,000 | $146,500 |
| 2016 | $2,246 | $226,900 | $83,000 | $143,900 |
| 2015 | $2,159 | $218,100 | $83,000 | $135,100 |
| 2014 | $1,920 | $213,500 | $91,300 | $122,200 |
Source: Public Records
Map
Nearby Homes
- 4045 Sherman Oaks Ave
- 3936 Peyton Way
- 3988 Cromwell Park Dr
- 1+ac Salem Rd
- 3920 Donnington Dr
- 4100 Starwood Arch
- 3912 Kiwanis Loop
- 3857 Whitley Park Dr
- 3939 Morning Light Ln
- 4006 Salem Terrace
- 2136 Brodeur Ln
- 3923 Lantana Place
- 3938 Morning Light Ln
- 3828 Kyndles Way
- 5049 Heathglen Cir
- 3948 Tartan Trail
- 4044 Laurel Green Cir
- 4153 Laurel Green Cir Unit 4153
- 4221 Laurel Green Cir
- 3809 Hazel Ct