409 NE 5th St Atlanta, IL 61723
Estimated Value: $169,000 - $197,000
--
Bed
--
Bath
--
Sq Ft
0.59
Acres
About This Home
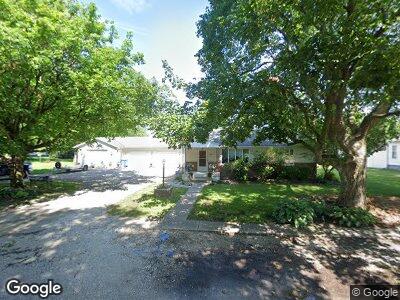
This home is located at 409 NE 5th St, Atlanta, IL 61723 and is currently estimated at $184,853. 409 NE 5th St is a home located in Logan County with nearby schools including Olympia High School.
Ownership History
Date
Name
Owned For
Owner Type
Purchase Details
Closed on
Feb 7, 2000
Sold by
Blankenship David and Blankenship Melanie
Bought by
Blankenship David W and Blankenship Melanie
Current Estimated Value
Create a Home Valuation Report for This Property
The Home Valuation Report is an in-depth analysis detailing your home's value as well as a comparison with similar homes in the area
Home Values in the Area
Average Home Value in this Area
Purchase History
| Date | Buyer | Sale Price | Title Company |
|---|---|---|---|
| Blankenship David W | -- | -- |
Source: Public Records
Mortgage History
| Date | Status | Borrower | Loan Amount |
|---|---|---|---|
| Open | Blankenship David W | $15,000 | |
| Open | Blankenship David W | $99,600 | |
| Closed | Blankenship David W | $101,250 |
Source: Public Records
Tax History Compared to Growth
Tax History
| Year | Tax Paid | Tax Assessment Tax Assessment Total Assessment is a certain percentage of the fair market value that is determined by local assessors to be the total taxable value of land and additions on the property. | Land | Improvement |
|---|---|---|---|---|
| 2023 | $3,977 | $54,530 | $8,810 | $45,720 |
| 2022 | $3,728 | $50,960 | $8,230 | $42,730 |
| 2021 | $3,627 | $49,630 | $8,020 | $41,610 |
| 2020 | $3,659 | $49,630 | $8,020 | $41,610 |
| 2019 | $3,704 | $50,350 | $8,140 | $42,210 |
| 2018 | $3,714 | $50,350 | $8,140 | $42,210 |
| 2017 | $3,582 | $48,420 | $7,830 | $40,590 |
| 2016 | $3,623 | $48,660 | $7,870 | $40,790 |
| 2015 | $3,019 | $46,570 | $7,530 | $39,040 |
| 2014 | $3,019 | $46,570 | $7,530 | $39,040 |
| 2013 | $3,019 | $43,920 | $7,100 | $36,820 |
| 2012 | $3,019 | $43,780 | $7,080 | $36,700 |
Source: Public Records
Map
Nearby Homes
- 307 NE 6th St
- 7 Sunnyside Estates
- 5 Sunnyside Estates
- 407 NW Race St
- Lot 46 E Lake Ct
- 23 N Lake Dr
- 46 N Lake Dr
- 610 SE Vine St
- 2200 2125th St
- 1505 2425th St
- 113 Dixie Rd
- 309 W Charles St
- 304 W Charles St
- 2988 N 400 Rd E
- 3625 N 400 Rd E
- 2322 2000th St
- 205 N Main St
- 0 Castle Pines Place Unit CA1015584
- 1568 N Walnut St
- 2294 Railsplitter Ave