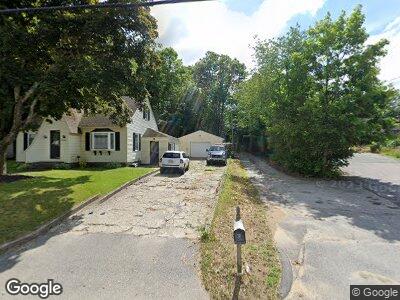
41 Leicester St North Oxford, MA 01537
Estimated Value: $346,579 - $399,000
3
Beds
1
Bath
1,408
Sq Ft
$266/Sq Ft
Est. Value
About This Home
This home is located at 41 Leicester St, North Oxford, MA 01537 and is currently estimated at $374,145, approximately $265 per square foot. 41 Leicester St is a home located in Worcester County with nearby schools including Alfred M Chaffee, Clara Barton Elementary School, and Oxford Middle School.
Ownership History
Date
Name
Owned For
Owner Type
Purchase Details
Closed on
Jul 19, 2006
Sold by
Lemieux Brendalee M and Halley Brent J
Bought by
Lemieux Brendalee M
Current Estimated Value
Home Financials for this Owner
Home Financials are based on the most recent Mortgage that was taken out on this home.
Original Mortgage
$85,500
Outstanding Balance
$53,411
Interest Rate
6.67%
Estimated Equity
$309,976
Purchase Details
Closed on
Oct 11, 1989
Sold by
Legere Annette
Bought by
Lemieux Brendalee
Create a Home Valuation Report for This Property
The Home Valuation Report is an in-depth analysis detailing your home's value as well as a comparison with similar homes in the area
Home Values in the Area
Average Home Value in this Area
Purchase History
| Date | Buyer | Sale Price | Title Company |
|---|---|---|---|
| Lemieux Brendalee M | -- | -- | |
| Lemieux Brendalee | $112,000 | -- |
Source: Public Records
Mortgage History
| Date | Status | Borrower | Loan Amount |
|---|---|---|---|
| Open | Lemieux Brendalee M | $85,500 | |
| Previous Owner | Lemieux Brendalee | $82,500 | |
| Previous Owner | Lemieux Brendalee | $18,000 | |
| Previous Owner | Lemieux Brendalee | $30,000 |
Source: Public Records
Tax History Compared to Growth
Tax History
| Year | Tax Paid | Tax Assessment Tax Assessment Total Assessment is a certain percentage of the fair market value that is determined by local assessors to be the total taxable value of land and additions on the property. | Land | Improvement |
|---|---|---|---|---|
| 2025 | $38 | $297,700 | $73,400 | $224,300 |
| 2024 | $3,811 | $282,700 | $70,000 | $212,700 |
| 2023 | $3,673 | $269,300 | $59,500 | $209,800 |
| 2022 | $3,575 | $221,200 | $63,200 | $158,000 |
| 2021 | $3,428 | $207,400 | $60,000 | $147,400 |
| 2020 | $3,294 | $197,700 | $60,000 | $137,700 |
| 2019 | $2,788 | $163,700 | $60,000 | $103,700 |
| 2018 | $2,827 | $163,700 | $60,000 | $103,700 |
| 2017 | $2,839 | $168,500 | $60,000 | $108,500 |
| 2016 | $2,853 | $168,500 | $60,000 | $108,500 |
| 2015 | $2,661 | $168,500 | $60,000 | $108,500 |
| 2014 | -- | $174,400 | $60,000 | $114,400 |
Source: Public Records
Map
Nearby Homes
- 4 Pine Hill Rd
- 134 Southbridge Rd
- 6 Thayer Pond Dr Unit 11
- 707 Main St
- 22 Thayer Pond Dr Unit 6
- 23 Thayer Pond Dr Unit 2
- 23 Thayer Pond Dr Unit 4
- 66 Pleasant St Unit 20
- 5 Stuart St
- 0 Athens St
- 60 Plantation Rd
- 198 West St
- 47 Plantation Rd
- 426 Stafford St
- 8 Hycrest Rd
- 14 Warren Rd
- 7 Hycrest Rd
- 4 Foster St
- 105 Hammond Hill Rd
- 11 Waterman Rd