
Seller's Agent in 2024
Aurora Banaszek
Compass Greater NY, LLC
(914) 318-2113
85 Total Sales
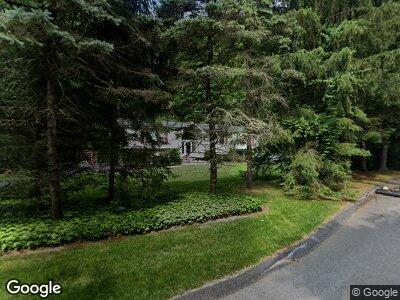
Light and bright 4 bedroom home located in a cul de sac in Byram Hills School District. Spacious home offers an open flow, level
yard, large screened in porch and separate fenced in yard. Prospective tenants will be required to show proof of financial
capability. Close to downtown Armonk, Bedford, and Greenwich. 50 minutes to NYC. 20 minutes to North White Plains for 38
minute express trains. House will be rented unfurnished. Additional Information: Amenities:Storage,HeatingFuel:Oil Above Ground,ParkingFeatures:2 Car Attached,Storage: Garage,LeaseTerm: Over 12 Months,12 Months,
| Date | Buyer | Sale Price | Title Company |
|---|---|---|---|
| Honig Marc | $720,000 | None Available |
| Date | Status | Borrower | Loan Amount |
|---|---|---|---|
| Open | Honig Marc | $520,000 | |
| Previous Owner | Long Edward J | $200,000 | |
| Previous Owner | Long Margherita F | $150,000 |
| Date | Event | Price | Change | Sq Ft Price |
|---|---|---|---|---|
| 12/05/2024 12/05/24 | Rented | $6,500 | 0.0% | -- |
| 11/05/2024 11/05/24 | Under Contract | -- | -- | -- |
| 08/03/2024 08/03/24 | For Rent | $6,500 | -7.1% | -- |
| 11/20/2023 11/20/23 | Rented | $7,000 | 0.0% | -- |
| 11/02/2023 11/02/23 | For Rent | $7,000 | -22.2% | -- |
| 03/31/2023 03/31/23 | Rented | $9,000 | +30.4% | -- |
| 03/08/2023 03/08/23 | For Rent | $6,900 | -31.0% | -- |
| 01/20/2023 01/20/23 | Rented | $10,000 | +42.9% | -- |
| 11/28/2022 11/28/22 | Price Changed | $7,000 | -6.7% | $2 / Sq Ft |
| 10/01/2022 10/01/22 | For Rent | $7,500 | +25.0% | -- |
| 11/08/2021 11/08/21 | Rented | $6,000 | -13.0% | -- |
| 09/11/2021 09/11/21 | Price Changed | $6,900 | -8.0% | $2 / Sq Ft |
| 08/17/2021 08/17/21 | For Rent | $7,500 | -99.0% | -- |
| 08/13/2021 08/13/21 | Under Contract | -- | -- | -- |
| 01/18/2013 01/18/13 | Sold | $720,000 | -5.3% | $208 / Sq Ft |
| 01/02/2013 01/02/13 | Pending | -- | -- | -- |
| 05/07/2012 05/07/12 | For Sale | $760,000 | -- | $219 / Sq Ft |
| Year | Tax Paid | Tax Assessment Tax Assessment Total Assessment is a certain percentage of the fair market value that is determined by local assessors to be the total taxable value of land and additions on the property. | Land | Improvement |
|---|---|---|---|---|
| 2024 | $14,692 | $16,000 | $3,200 | $12,800 |
| 2023 | $17,251 | $16,000 | $3,200 | $12,800 |
| 2022 | $15,408 | $16,000 | $3,200 | $12,800 |
| 2021 | $15,158 | $16,000 | $3,200 | $12,800 |
| 2020 | $15,205 | $16,000 | $3,200 | $12,800 |
| 2019 | $16,485 | $16,000 | $3,200 | $12,800 |
| 2018 | $15,047 | $16,000 | $3,200 | $12,800 |
| 2017 | $5,165 | $16,000 | $3,200 | $12,800 |
| 2016 | $16,150 | $16,000 | $3,200 | $12,800 |
| 2015 | -- | $16,000 | $3,200 | $12,800 |
| 2014 | -- | $16,000 | $3,200 | $12,800 |
| 2013 | -- | $20,400 | $3,200 | $17,200 |
Seller's Agent in 2024
Aurora Banaszek
Compass Greater NY, LLC
(914) 318-2113
85 Total Sales
Buyer's Agent in 2024
Candice Stafford
Julia B Fee Sothebys Int. Rlty
(914) 649-3773
12 Total Sales
Buyer's Agent in 2023
Julie Schneider
Compass Greater NY, LLC
(914) 261-3569
70 Total Sales
F
Buyer's Agent in 2023
Fabio Ricci
Keller Williams NY Realty
(914) 487-9234
52 Total Sales
Buyer's Agent in 2021
Dana Goldman
Compass Greater NY, LLC
(917) 757-4953
48 Total Sales
T
Seller's Agent in 2013
Trudi Gallagher
Houlihan Lawrence Inc.