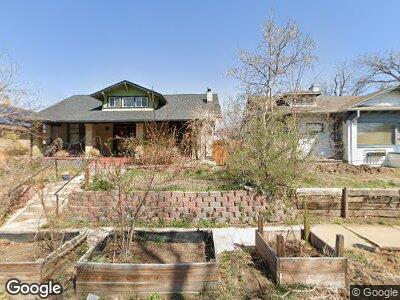
4100 Stuart St Denver, CO 80212
Berkeley NeighborhoodEstimated Value: $756,000 - $945,727
2
Beds
2
Baths
1,485
Sq Ft
$585/Sq Ft
Est. Value
About This Home
This home is located at 4100 Stuart St, Denver, CO 80212 and is currently estimated at $868,182, approximately $584 per square foot. 4100 Stuart St is a home located in Denver County with nearby schools including Bryant Webster Dual Language School, Skinner Middle School, and Denver Montessori Junior/Senior High School.
Ownership History
Date
Name
Owned For
Owner Type
Purchase Details
Closed on
Dec 1, 2005
Sold by
Beall Wilkin L
Bought by
Fritts Roger D and Fritts Susanne K
Current Estimated Value
Home Financials for this Owner
Home Financials are based on the most recent Mortgage that was taken out on this home.
Original Mortgage
$118,000
Outstanding Balance
$67,910
Interest Rate
6.29%
Mortgage Type
Fannie Mae Freddie Mac
Estimated Equity
$800,272
Purchase Details
Closed on
Apr 15, 1997
Sold by
Pietrangelo Steven D
Bought by
Beall Wilkin L
Home Financials for this Owner
Home Financials are based on the most recent Mortgage that was taken out on this home.
Original Mortgage
$112,500
Interest Rate
7.82%
Purchase Details
Closed on
Oct 26, 1995
Sold by
Bilchak Rosemary V
Bought by
Pietrangelo Steven D
Home Financials for this Owner
Home Financials are based on the most recent Mortgage that was taken out on this home.
Original Mortgage
$97,600
Interest Rate
7.6%
Create a Home Valuation Report for This Property
The Home Valuation Report is an in-depth analysis detailing your home's value as well as a comparison with similar homes in the area
Home Values in the Area
Average Home Value in this Area
Purchase History
| Date | Buyer | Sale Price | Title Company |
|---|---|---|---|
| Fritts Roger D | $294,000 | Chicago Title Co | |
| Beall Wilkin L | $150,000 | -- | |
| Pietrangelo Steven D | $114,850 | -- |
Source: Public Records
Mortgage History
| Date | Status | Borrower | Loan Amount |
|---|---|---|---|
| Open | Fritts Roger D | $118,000 | |
| Previous Owner | Beall Wilkin L | $50,000 | |
| Previous Owner | Beall Wilkin L | $25,000 | |
| Previous Owner | Beall Wilkin L | $112,500 | |
| Previous Owner | Pietrangelo Steven D | $97,600 |
Source: Public Records
Tax History Compared to Growth
Tax History
| Year | Tax Paid | Tax Assessment Tax Assessment Total Assessment is a certain percentage of the fair market value that is determined by local assessors to be the total taxable value of land and additions on the property. | Land | Improvement |
|---|---|---|---|---|
| 2024 | $4,177 | $52,740 | $50,080 | $2,660 |
| 2023 | $4,087 | $52,740 | $50,080 | $2,660 |
| 2022 | $3,620 | $45,520 | $41,490 | $4,030 |
| 2021 | $3,495 | $46,840 | $42,690 | $4,150 |
| 2020 | $2,926 | $39,440 | $34,420 | $5,020 |
| 2019 | $2,844 | $39,440 | $34,420 | $5,020 |
| 2018 | $2,886 | $37,300 | $27,730 | $9,570 |
| 2017 | $2,877 | $37,300 | $27,730 | $9,570 |
| 2016 | $2,753 | $33,760 | $24,270 | $9,490 |
| 2015 | $2,638 | $33,760 | $24,270 | $9,490 |
| 2014 | $2,277 | $27,410 | $19,160 | $8,250 |
Source: Public Records
Map
Nearby Homes
- 4144 Tennyson St Unit 212
- 3921 N Raleigh St
- 4212 N Raleigh St
- 3916 N Raleigh St
- 4258 Tennyson St
- 3928 Vrain St
- 3953 Vrain St
- 3835 N Raleigh St
- 3946 Perry St
- 4253 Perry St
- 3922 Winona Ct
- 4383 Tennyson St Unit 3-E
- 4346 N Raleigh St
- 3947 Winona Ct
- 3925 Winona Ct
- 4325 Perry St
- 3884 Osceola St
- 3890 Wolff St
- 4426 Utica St
- 4440 Tennyson St Unit 4