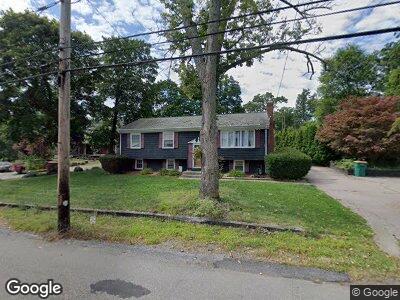
411 Smith St North Attleboro, MA 02760
Estimated Value: $506,000 - $699,000
4
Beds
2
Baths
1,456
Sq Ft
$394/Sq Ft
Est. Value
About This Home
This home is located at 411 Smith St, North Attleboro, MA 02760 and is currently estimated at $574,289, approximately $394 per square foot. 411 Smith St is a home located in Bristol County with nearby schools including North Attleboro High School, Cadence Academy Preschool - North Attleborough, and Bishop Feehan High School.
Ownership History
Date
Name
Owned For
Owner Type
Purchase Details
Closed on
May 17, 2011
Sold by
Hall James K and Hall Donna M
Bought by
Christopher
Current Estimated Value
Home Financials for this Owner
Home Financials are based on the most recent Mortgage that was taken out on this home.
Original Mortgage
$281,673
Outstanding Balance
$200,540
Interest Rate
4.88%
Mortgage Type
Purchase Money Mortgage
Estimated Equity
$373,749
Purchase Details
Closed on
Oct 2, 1995
Sold by
Ruddy Lawrence J and Ruddy Rose M
Bought by
Hall James K and Hall Donna M
Purchase Details
Closed on
Mar 26, 1992
Sold by
Milford Fed S&L
Bought by
Ruddy Lawrence J and Ruddy Rose M
Create a Home Valuation Report for This Property
The Home Valuation Report is an in-depth analysis detailing your home's value as well as a comparison with similar homes in the area
Home Values in the Area
Average Home Value in this Area
Purchase History
| Date | Buyer | Sale Price | Title Company |
|---|---|---|---|
| Christopher | $289,000 | -- | |
| Hall James K | $140,400 | -- | |
| Ruddy Lawrence J | $43,000 | -- |
Source: Public Records
Mortgage History
| Date | Status | Borrower | Loan Amount |
|---|---|---|---|
| Open | Christopher | $281,673 | |
| Previous Owner | Hall James K | $200,000 | |
| Previous Owner | Ruddy Lawrence J | $123,800 | |
| Previous Owner | Ruddy Lawrence J | $180,000 | |
| Previous Owner | Ruddy Lawrence J | $132,250 |
Source: Public Records
Tax History Compared to Growth
Tax History
| Year | Tax Paid | Tax Assessment Tax Assessment Total Assessment is a certain percentage of the fair market value that is determined by local assessors to be the total taxable value of land and additions on the property. | Land | Improvement |
|---|---|---|---|---|
| 2025 | $5,396 | $457,700 | $141,100 | $316,600 |
| 2024 | $5,156 | $446,800 | $141,100 | $305,700 |
| 2023 | $5,135 | $401,500 | $141,100 | $260,400 |
| 2022 | $4,956 | $355,800 | $141,100 | $214,700 |
| 2021 | $4,625 | $324,100 | $141,100 | $183,000 |
| 2020 | $4,507 | $314,100 | $141,100 | $173,000 |
| 2019 | $4,292 | $301,400 | $128,400 | $173,000 |
| 2018 | $0 | $287,000 | $128,400 | $158,600 |
| 2017 | $12,985 | $277,000 | $128,400 | $148,600 |
| 2016 | $3,708 | $280,500 | $142,700 | $137,800 |
| 2015 | $3,558 | $270,800 | $149,900 | $120,900 |
| 2014 | $3,454 | $260,900 | $138,500 | $122,400 |
Source: Public Records
Map
Nearby Homes
- 711 Mount Hope St Unit 19
- 711 Mount Hope St Unit 20
- 711 Mount Hope St Unit 18
- 711 Mount Hope St Unit 17
- 25 2nd Ave Unit 10
- 0 Landry 2nd Unit 73350867
- 304 Elm St
- 3 Lafayette St
- 216 Fisher St
- 300 E Washington St Unit 2R
- 300 E Washington St Unit 54R
- 426 Mount Hope St Unit 207
- 68 N Washington St Unit 514
- 835 Mount Hope St Unit 50
- 835 Mount Hope St Unit 7
- 42 Jennifer Cir
- 49 Church St
- 76 Bank St
- 85 Bank St
- 197 Broadway