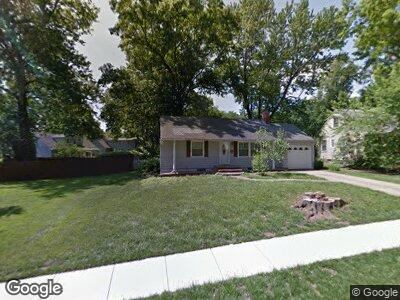
4113 Oxford Rd Prairie Village, KS 66208
Fairway NeighborhoodEstimated Value: $1,413,000 - $1,767,000
4
Beds
6
Baths
4,303
Sq Ft
$368/Sq Ft
Est. Value
About This Home
This home is located at 4113 Oxford Rd, Prairie Village, KS 66208 and is currently estimated at $1,583,460, approximately $367 per square foot. 4113 Oxford Rd is a home located in Johnson County with nearby schools including Prairie Elementary School, Indian Hills Middle School, and Shawnee Mission East High School.
Ownership History
Date
Name
Owned For
Owner Type
Purchase Details
Closed on
Jun 17, 2021
Sold by
Eddy Mark and Eddy Constance
Bought by
Eddy Mark Matthew and Eddy Constance Marie
Current Estimated Value
Purchase Details
Closed on
Nov 21, 2018
Sold by
Gahagan Eddy Real Estate Llc
Bought by
Eddy Mark and Eddy Constance
Purchase Details
Closed on
Jun 29, 2018
Sold by
Fmcalways Llc
Bought by
Gahagan Eddy Real Estate Llc
Home Financials for this Owner
Home Financials are based on the most recent Mortgage that was taken out on this home.
Original Mortgage
$228,000
Interest Rate
4.6%
Mortgage Type
Purchase Money Mortgage
Purchase Details
Closed on
May 31, 2017
Sold by
Bard Rosetta A
Bought by
Fmcalways Llc
Create a Home Valuation Report for This Property
The Home Valuation Report is an in-depth analysis detailing your home's value as well as a comparison with similar homes in the area
Home Values in the Area
Average Home Value in this Area
Purchase History
| Date | Buyer | Sale Price | Title Company |
|---|---|---|---|
| Eddy Mark Matthew | -- | None Available | |
| Eddy Mark | -- | Assured Quality Title Co | |
| Gahagan Eddy Real Estate Llc | -- | Continental Title | |
| Fmcalways Llc | -- | Continental Title |
Source: Public Records
Mortgage History
| Date | Status | Borrower | Loan Amount |
|---|---|---|---|
| Open | Eddy Mark | $334,000 | |
| Open | Eddy Mark | $835,000 | |
| Closed | Eddy Mark | $404,270 | |
| Closed | Gahagan Eddy Real Estate Llc | $228,000 | |
| Previous Owner | Bard Rosetta A | $130,475 | |
| Previous Owner | Bard Rosetta A | $25,000 | |
| Previous Owner | Bard Rosetta A | $136,250 | |
| Previous Owner | Bard Rosetta A | $35,000 |
Source: Public Records
Tax History Compared to Growth
Tax History
| Year | Tax Paid | Tax Assessment Tax Assessment Total Assessment is a certain percentage of the fair market value that is determined by local assessors to be the total taxable value of land and additions on the property. | Land | Improvement |
|---|---|---|---|---|
| 2024 | $20,565 | $179,136 | $22,109 | $157,027 |
| 2023 | $18,988 | $165,002 | $21,058 | $143,944 |
| 2022 | $16,714 | $145,164 | $18,309 | $126,855 |
| 2021 | $17,148 | $142,404 | $18,309 | $124,095 |
| 2020 | $14,315 | $117,047 | $16,646 | $100,401 |
| 2019 | $3,138 | $24,130 | $13,872 | $10,258 |
| 2018 | $0 | $23,805 | $12,610 | $11,195 |
| 2017 | $2,750 | $20,804 | $9,698 | $11,106 |
| 2016 | $2,346 | $17,262 | $6,923 | $10,339 |
| 2015 | $2,278 | $16,974 | $6,923 | $10,051 |
| 2013 | -- | $16,319 | $6,025 | $10,294 |
Source: Public Records
Map
Nearby Homes
- 4306 W 70th St
- 4320 W 70th St
- 7130 Village Dr
- 4201 W 67th Terrace
- 6739 Fontana St
- 4201 W 73rd St
- 3916 W 72nd Terrace
- 7232 Village Dr
- 4608 W 72nd St
- 6812 Granada Ln
- 6717 Granada Rd
- 4617 W 72nd St
- 3508 W 69th St
- 6712 Granada Rd
- 7051 Linden St
- 7412 Village Dr
- 3405 W 71st St
- 7220 Roe Ave
- 4607 W 72nd Terrace
- 3310 W 71st Terrace