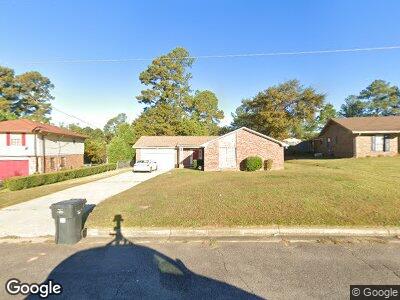
4117 Pinnacle Pines Ct Hephzibah, GA 30815
Jamestown NeighborhoodEstimated Value: $215,944 - $240,000
3
Beds
2
Baths
1,735
Sq Ft
$133/Sq Ft
Est. Value
About This Home
This home is located at 4117 Pinnacle Pines Ct, Hephzibah, GA 30815 and is currently estimated at $230,236, approximately $132 per square foot. 4117 Pinnacle Pines Ct is a home located in Richmond County with nearby schools including Deer Chase Elementary School, Hephzibah Middle School, and Johnson Magnet.
Ownership History
Date
Name
Owned For
Owner Type
Purchase Details
Closed on
Sep 13, 2017
Sold by
Patten Robert
Bought by
Patten Robert and Patten Yvonne
Current Estimated Value
Purchase Details
Closed on
May 21, 2002
Sold by
Patten Yvonne
Bought by
Patten Robert
Home Financials for this Owner
Home Financials are based on the most recent Mortgage that was taken out on this home.
Original Mortgage
$60,701
Interest Rate
6.92%
Purchase Details
Closed on
Jul 2, 2001
Sold by
Patten Glossine D
Bought by
Patten Robert
Purchase Details
Closed on
Mar 17, 1997
Sold by
Patten Glossine D Patten Robert
Bought by
Patten Glossine Dnpatten Robert L and Patten E
Purchase Details
Closed on
Jun 24, 1994
Sold by
Patten Robert
Bought by
Patten Yvonne
Purchase Details
Closed on
Dec 30, 1991
Sold by
Patten Robert
Bought by
Patten Glossine D
Purchase Details
Closed on
Oct 1, 1986
Sold by
Mcdonald Raymond B
Bought by
Patten Robert
Create a Home Valuation Report for This Property
The Home Valuation Report is an in-depth analysis detailing your home's value as well as a comparison with similar homes in the area
Home Values in the Area
Average Home Value in this Area
Purchase History
| Date | Buyer | Sale Price | Title Company |
|---|---|---|---|
| Patten Robert | -- | -- | |
| Patten Robert | -- | -- | |
| Patten Robert | -- | -- | |
| Patten Glossine Dnpatten Robert L | -- | -- | |
| Patten Yvonne | -- | -- | |
| Patten Glossine D | -- | -- | |
| Patten Robert | $76,900 | -- |
Source: Public Records
Mortgage History
| Date | Status | Borrower | Loan Amount |
|---|---|---|---|
| Open | Patten Robert | $82,200 | |
| Previous Owner | Patten Robert | $106,328 | |
| Previous Owner | Patten Robert | $20,000 | |
| Previous Owner | Patten Robert | $60,701 |
Source: Public Records
Tax History Compared to Growth
Tax History
| Year | Tax Paid | Tax Assessment Tax Assessment Total Assessment is a certain percentage of the fair market value that is determined by local assessors to be the total taxable value of land and additions on the property. | Land | Improvement |
|---|---|---|---|---|
| 2024 | $1,001 | $76,024 | $10,260 | $65,764 |
| 2023 | $1,001 | $73,264 | $10,260 | $63,004 |
| 2022 | $898 | $53,478 | $10,260 | $43,218 |
| 2021 | $814 | $41,042 | $10,260 | $30,782 |
| 2020 | $818 | $41,042 | $10,260 | $30,782 |
| 2019 | $848 | $41,042 | $10,260 | $30,782 |
| 2018 | $852 | $41,042 | $10,260 | $30,782 |
| 2017 | $813 | $41,042 | $10,260 | $30,782 |
| 2016 | $814 | $41,042 | $10,260 | $30,782 |
| 2015 | $814 | $41,042 | $10,260 | $30,782 |
| 2014 | $814 | $41,042 | $10,260 | $30,782 |
Source: Public Records
Map
Nearby Homes
- 2718 Tobacco Rd
- 3753 Woodcock Dr
- 3504 Firestone Dr Unit 121
- 3603 Chisum Ct
- 4325 Creekview Dr
- 3605 Hiers Blvd
- 4346 Creekview Dr
- 3951 Crest Dr
- 3703 Lyncrest Dr
- 3878 Woodlake Dr
- 2838 Pepperdine Dr
- 3697 Woodcock Dr
- 2614 Sadie Ct
- 3747 Crest Dr
- 3743 Crest Dr
- 1505 Oglethorpe Dr
- 2161 Kaneck Way
- 2159 Kaneck Way
- 3807 Fairington Dr
- 2640 Carrington Dr