4124 NW 51st St Oklahoma City, OK 73112
Springdale NeighborhoodEstimated Value: $199,442 - $225,000
--
Bed
--
Bath
1,262
Sq Ft
$166/Sq Ft
Est. Value
About This Home
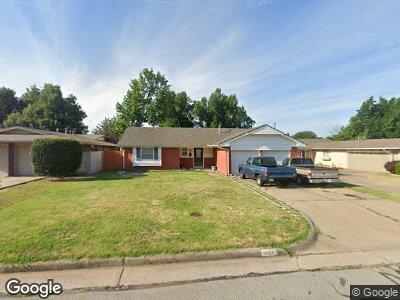
This home is located at 4124 NW 51st St, Oklahoma City, OK 73112 and is currently estimated at $208,861, approximately $165 per square foot. 4124 NW 51st St is a home with nearby schools including Coronado Heights Elementary School, James L. Capps Middle School, and Putnam City High School.
Ownership History
Date
Name
Owned For
Owner Type
Purchase Details
Closed on
Oct 15, 2010
Sold by
Mull Properties Llc
Bought by
Mercado Jim P and Mercado Terri Leigh
Current Estimated Value
Home Financials for this Owner
Home Financials are based on the most recent Mortgage that was taken out on this home.
Original Mortgage
$113,471
Interest Rate
4.5%
Mortgage Type
FHA
Purchase Details
Closed on
Jan 15, 2010
Sold by
Lambert Jennie C and Lambert Barak
Bought by
Mull Properties Llc
Home Financials for this Owner
Home Financials are based on the most recent Mortgage that was taken out on this home.
Original Mortgage
$30,000
Interest Rate
5.11%
Mortgage Type
Unknown
Purchase Details
Closed on
Jun 21, 2007
Sold by
Ross Val R and Ross Mary T
Bought by
Lambert Jennie C and Lambert Barak
Home Financials for this Owner
Home Financials are based on the most recent Mortgage that was taken out on this home.
Original Mortgage
$100,670
Interest Rate
6.37%
Mortgage Type
Purchase Money Mortgage
Create a Home Valuation Report for This Property
The Home Valuation Report is an in-depth analysis detailing your home's value as well as a comparison with similar homes in the area
Home Values in the Area
Average Home Value in this Area
Purchase History
| Date | Buyer | Sale Price | Title Company |
|---|---|---|---|
| Mercado Jim P | $115,000 | Old Republic Title Co Of Ok | |
| Mull Properties Llc | $14,000 | Old Republic Title Co Of Ok | |
| Lambert Jennie C | $98,000 | Stewart Abstract & Title Of |
Source: Public Records
Mortgage History
| Date | Status | Borrower | Loan Amount |
|---|---|---|---|
| Open | Lunday Lauren E | $250,000 | |
| Closed | Mercado Terri | $120,000 | |
| Closed | Mercado Jim P | $113,471 | |
| Previous Owner | Mull Properties Llc | $30,000 | |
| Previous Owner | Lambert Jennie C | $100,670 |
Source: Public Records
Tax History Compared to Growth
Tax History
| Year | Tax Paid | Tax Assessment Tax Assessment Total Assessment is a certain percentage of the fair market value that is determined by local assessors to be the total taxable value of land and additions on the property. | Land | Improvement |
|---|---|---|---|---|
| 2024 | $1,977 | $17,733 | $2,510 | $15,223 |
| 2023 | $1,977 | $17,217 | $2,072 | $15,145 |
| 2022 | $1,939 | $16,714 | $2,264 | $14,450 |
| 2021 | $1,861 | $16,228 | $2,551 | $13,677 |
| 2020 | $1,796 | $15,756 | $2,679 | $13,077 |
| 2019 | $1,714 | $15,297 | $2,374 | $12,923 |
| 2018 | $1,663 | $14,852 | $0 | $0 |
| 2017 | $1,614 | $14,418 | $2,438 | $11,980 |
| 2016 | $1,560 | $13,999 | $2,478 | $11,521 |
| 2015 | $1,529 | $13,592 | $2,376 | $11,216 |
| 2014 | $1,444 | $13,355 | $2,376 | $10,979 |
Source: Public Records
Map
Nearby Homes
- 5200 N Tulsa Ave
- 5202 N Tulsa Ave
- 5016 N Utah Ave
- 4333 NW 55th St
- 4225 NW 44th St
- 4329 NW 44th St
- 4412 NW 57th St
- 3724 NW 48th Cir
- 5712 N Roff Ave
- 3700 Quapah Cir
- 3805 NW 57th St
- 5917 N Roff Ave
- 4600 NW 46th St
- 4221 NW 60th St
- 5817 N Meridian Place
- 4228 NW 61 St
- 4044 NW 62nd Terrace
- 6108 N Quapah Ave
- 3609 NW 43rd St
- 6300 N Warren Ave